Stocks On The Blockchain - Do They Have Product-Market Fit?
These two verticals are new and growing fast, but as seen many times in crypto, growth in market capitalization and trading volume don’t necessarily correspond to long-term anti-fragile adoption. Do stocks on crypto rails have product-market fit so far?

The Landscape Of Stocks On The Blockchain
In the past year the industry has seen the growth of stocks on blockchain rails, both on spot and on perpetual DEXes. Tokenized equities' on-chain active market cap has gone from roughly $429M a year ago to $3.76B today — a ~9x increase — while a parallel and much larger market has emerged in leveraged synthetic exposure: perp venues referencing individual stocks, ETFs, and indices, which have moved $105.7B in the last 30 days alone.
These two verticals are new and growing fast — but as seen many times in crypto, growth in market capitalization and trading volume don’t necessarily correspond to long-term anti-fragile adoption. That’s the question this piece sets out to answer: do stocks on crypto rails actually have product-market fit so far?
A Brief Explanation Of Stocks On-Chain And Stock Perps
Broadly speaking, there have been two categories of adoption for stocks on crypto rails and they operate under fundamentally different mechanics.
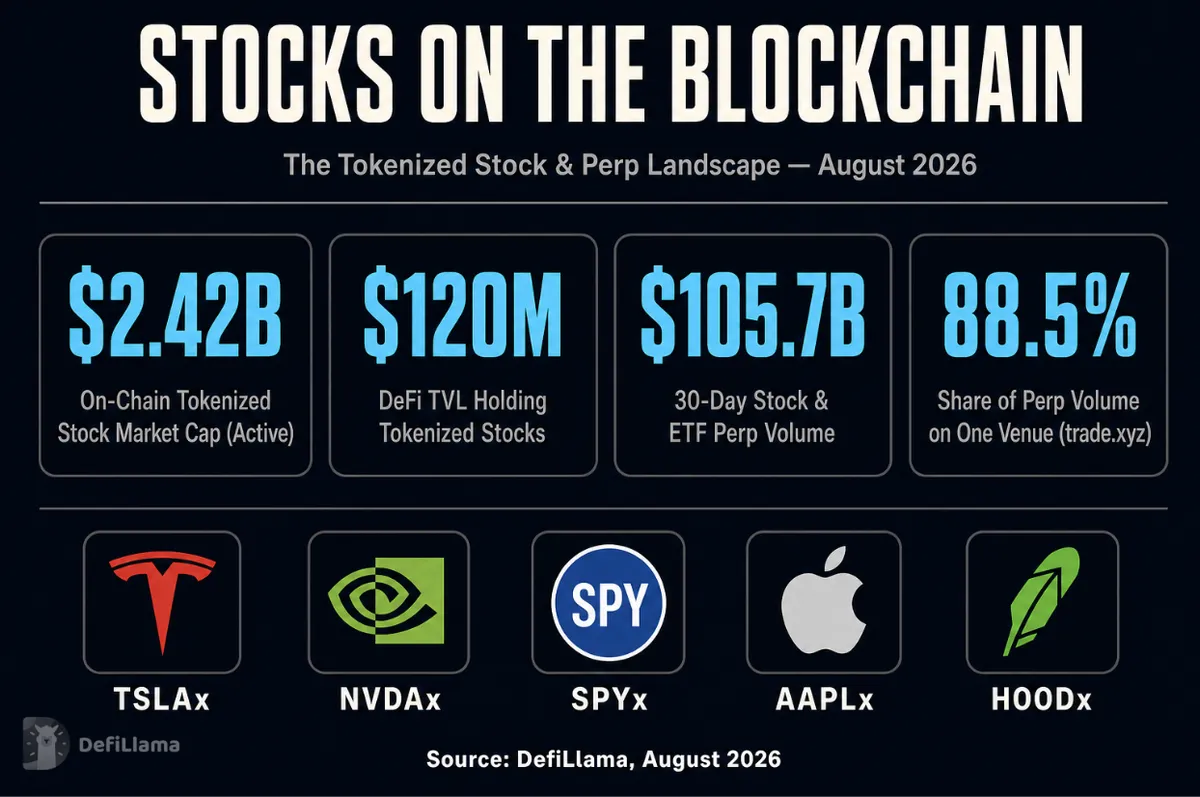
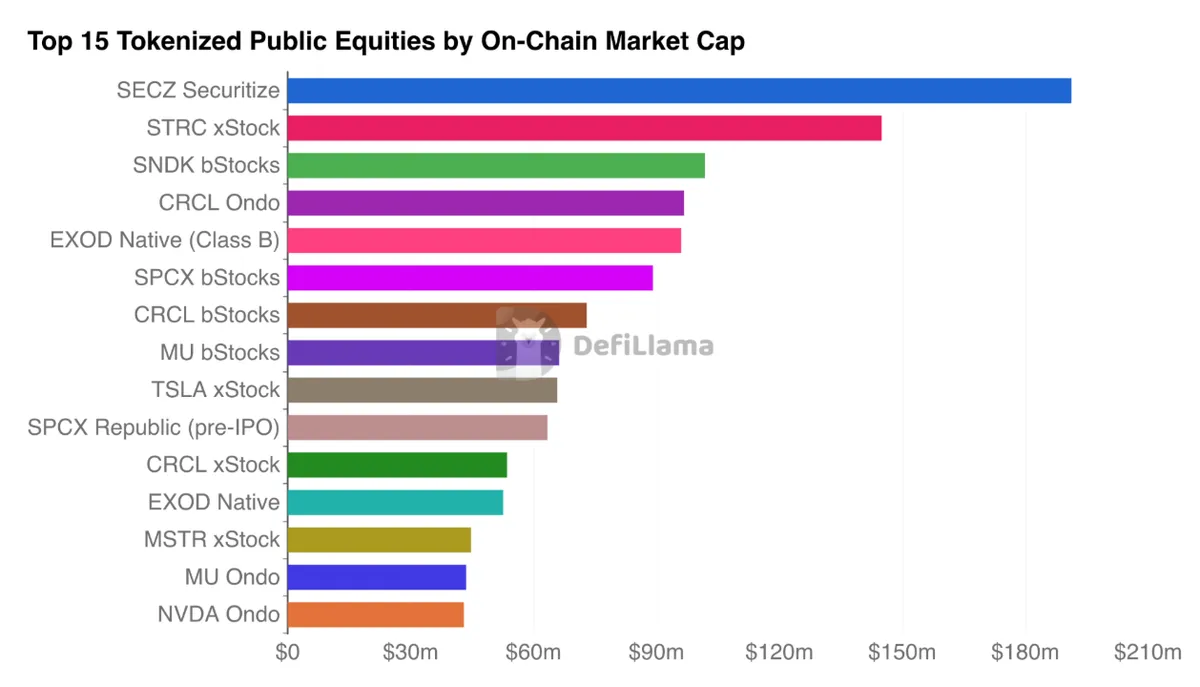
On-chain tokenized equities are blockchain-native representations of real-world stocks. A regulated issuer holds the underlying shares with a qualified custodian and mints tokens that track those shares 1:1. The token lives on the blockchain and can be traded on decentralized venues, and in some cases, be redeemed for the underlying stock. The market currently stands at roughly $2.42 billion in active market capitalization.

Stock perpetuals are the other side of the coin. These perpetual futures contracts reference individual stocks, ETFs, or equity indices, and are traded on derivatives exchanges. But they carry no claim on the underlying share. What they offer instead is leverage — typically 2x to 20x — and 24/7 access to price exposure.
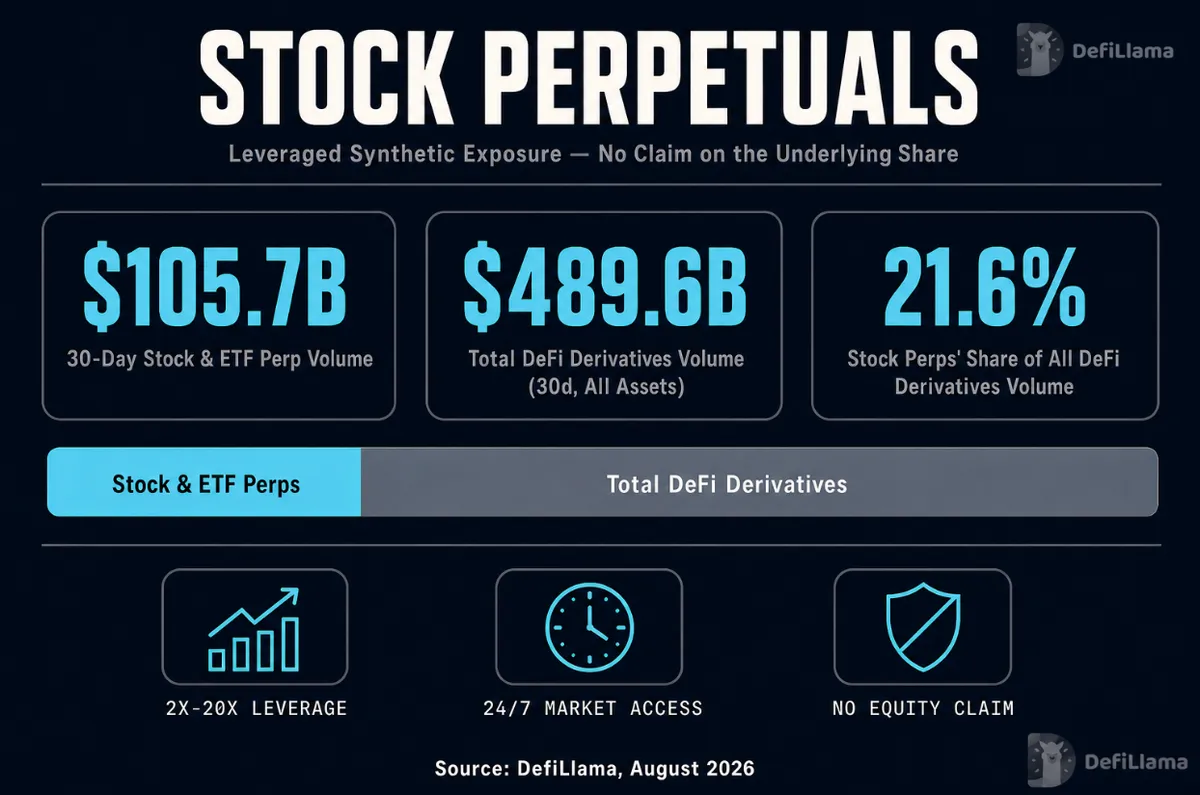
In the last 30 days alone, perp venues referencing equities moved approximately $105.7 billion in notional volume. For context, the entire DeFi derivatives market across all assets (crypto pairs, forex, commodities, and equities) processed $489.5 billion over the same period. Stock perps alone represent roughly 21% of that.
Breaking Down The Landscapes
On-Chain
Three major entities dominate the on-chain tokenized-equities landscape: Backed/Kraken's xStocks, Ondo Global Markets, and bTech Holdings.
Backed Finance, the issuer of xStocks, was acquired by Kraken in a deal announced December 2, 2025. Since its debut, xStocks has passed $10B in combined exchange and on-chain trading volume. On-chain, xStocks currently carry $866M in tracked market cap across 191 distinct assets.
Ondo Global Markets launched September 3, 2025 with 100+ tokenized U.S. stocks and ETFs on Ethereum, backed by securities held at U.S.-registered broker-dealers. It has since scaled to 415 total tracked assets, with $917.2M in tracked on-chain market cap, making it the largest on-chain issuer of tokenized equities.
bTech Holdings, a Binance Group affiliate registered in the Abu Dhabi Global Market, issues bStocks — the tokenized-equity product available on Binance and self-custodied on BNB Chain. bTech is the third-largest issuer, with $564.5m in on-chain market cap — 18% of the tracked market.
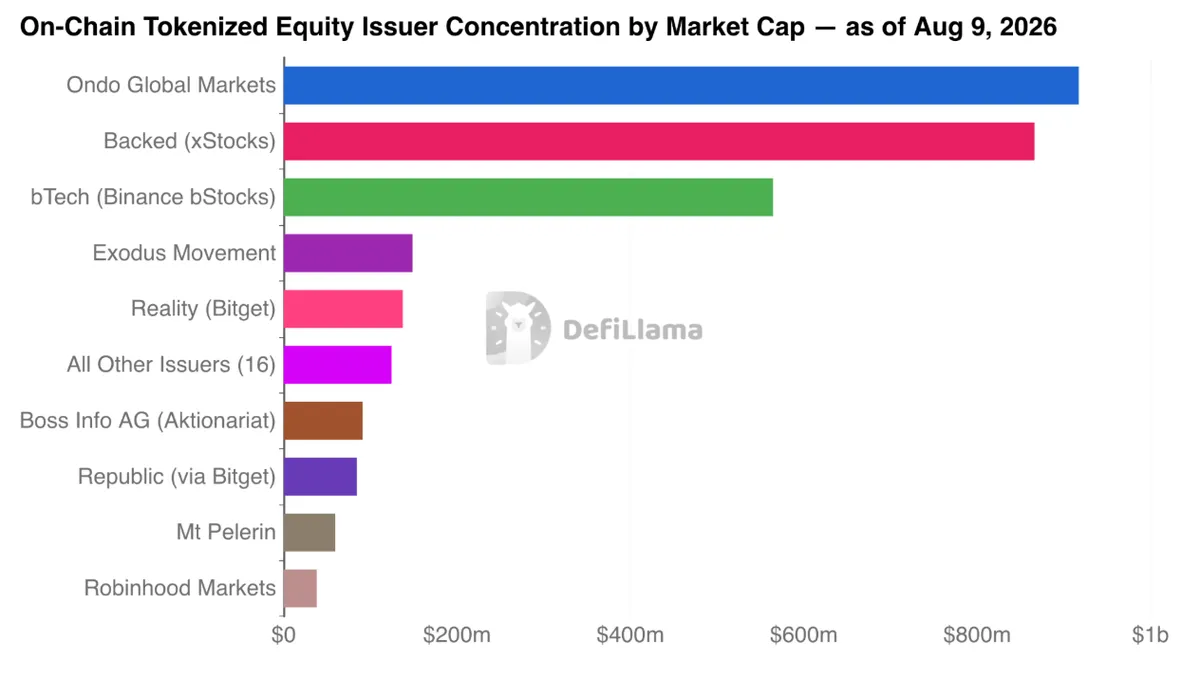
Issuer | Onchain Mcap | Share | Assets |
|---|---|---|---|
Ondo Global Markets | $917.2M | 30.26% | 415 |
Backed (xStocks) | $866.0M | 28.57% | 191 |
bTech (bStocks) | $564.5M | 18.62% | 35 |
Perpetuals
The tokenized-equity perp landscape looks structurally different from the on-chain spot market — one venue has already mostly won. Across the 19 venues DefiLlama tracks for stock/index/ETF-referencing perpetuals, a single venue, trade.xyz on Hyperliquid, accounts for $93.5B — an 88.47% share.
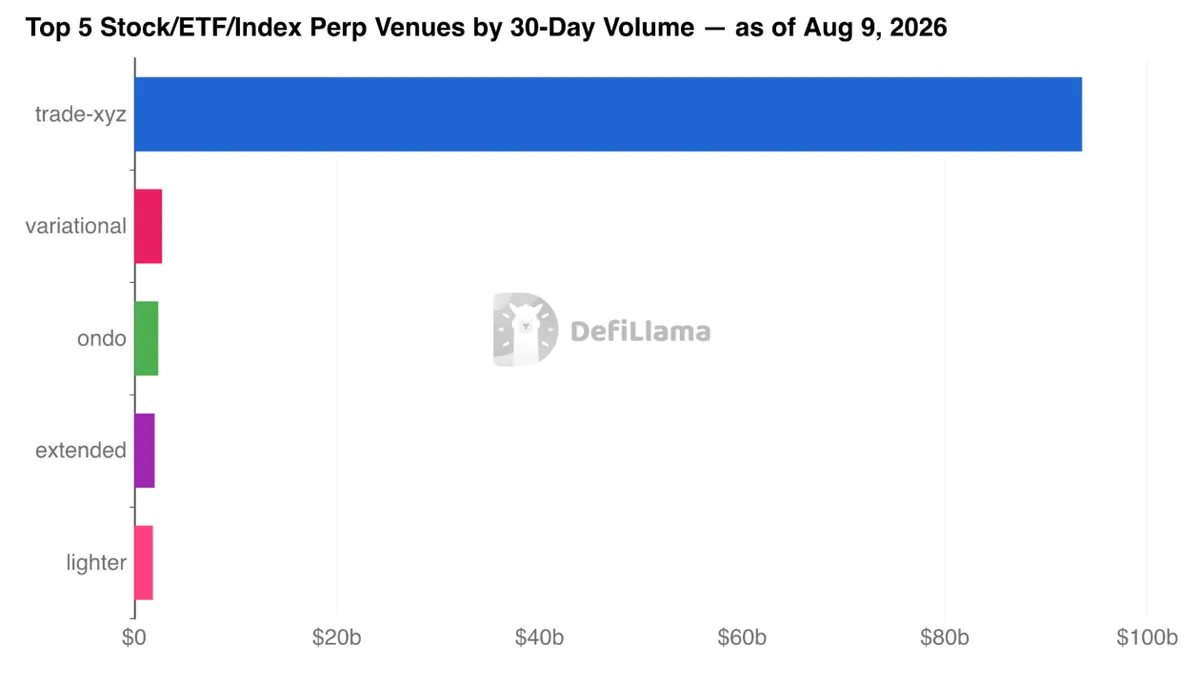
Venue | 30d Volume | Open Interest | 30D Fees | Notes |
|---|---|---|---|---|
$93.55B | $2.90B | $23.39M | Hyperliquid HIP-3 deployer | |
Variational | $2.75B | $216.2M | $0 | Standalone |
Ondo (perp desk) | $2.37B | $35.7M | $415K | Permissioned, separate from Ondo Global Markets spot |
Extended | $2.01B | $13.2M | $503K | Standalone |
Trade.xyz isn't a standalone matching engine; it's a HIP-3 deployer running on Hyperliquid’s HyperCore infrastructure — builders can deploy their own perpetual markets on top of Hyperliquid under its HIP-3 framework. Trade.xyz's RWA flow alone equals 61.5% of all volume moving through Hyperliquid's derivatives engine over the same window ($118.4B against Hyperliquid's $192.5B 30-day total). RWA perps aren't a side product for Hyperliquid anymore, they're a majority of its printed volume.
This is very clearly a winner-take-most market. Beyond trade.xyz, the top five venues capture 96.86% of all 30 day volume, leaving no space for any other competitors.
Analyzing Product-Market Fit Across Both
To measure product-market fit, we will be examining both on-chain and perpetuals across the same set of metrics:
Name | What it measures | Methodology |
|---|---|---|
Size | Growth over time and capital commitment | On-chain: active/on-chain market cap. Perps: open interest. |
Turnover | Is that capital moving, or just sitting there | On-chain: 30d volume ÷ market cap. Perps: 30d volume ÷ OI |
Concentration | Is it broad-based, or a couple of players | On-chain: issuer/asset share Perps: venue share |
Consistency | Is activity steady, or a few spike days doing all the work | Coefficient of variation on daily volume. |
Size - Growth Of The Asset Class
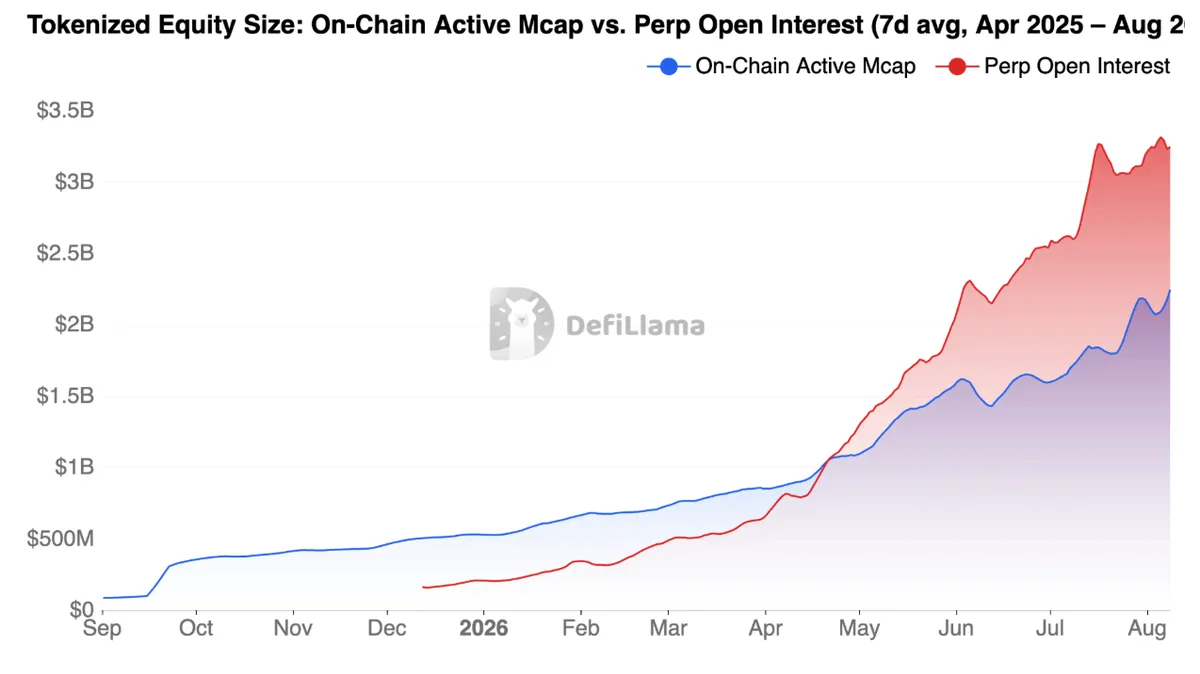
On-chain tokenized equity market cap grew from $22.6 million in April 2025 to $2.42 billion by August 2026 — a 99x increase over 16 months. This incredible rate of change is only outmatched by the growth on the side of perpetual open interest, which grew from roughly $162.6 million in December 2025 to $3.25 billion by August 2026, a 20x increase in under eight months. However, when comparing the two during a common period — from the launch of perpetual open interest markets in December 2025 until now — perps grew by 20x, while on-chain equities only grew by 4.5x.
Two things stand out from this apples-to-apples comparison:
Perps are growing faster than on-chain issuance, and have overtaken it in absolute size. Perp open interest started with less than a third of on-chain market cap and finished ~44% larger, in a shorter span of time.
On-chain growth is real but slower than the headline multi-year figure suggests. The ~99x figure spans the whole series from a very small April 2025 base (~$22.6M) — a base low enough that even modest dollar inflows produce large multiples. The 4.5x common-window figure is the fairer read of recent on-chain momentum next to perps.
While perps are growing faster than on-chain, one thing is clear: both are growing at astonishing rates that only products with PMF can exhibit.
Turnover - Capital Measurement Of Both Asset Classes
While size tells us how much capital each market has attracted, turnover tells us what that capital is actually doing — whether it's being actively traded or simply parked. We measure it on a consistent 30-day window for both sides (30-day volume ÷ active market cap on-chain, 30-day volume ÷ open interest for perps), scoped to the same universe (public equities, equity indices, and equity ETFs):
Metric | On-Chain | Perps |
|---|---|---|
Total size (mcap / OI) | $2.36B | $3.26B |
Total volume (30d) | $11.25B | $105.7B |
Turnover ratio (native window) | 4.66x/30d | 32.39x/30d |
Turnover ratio (daily-equivalent) | 0.155x/day | 1.08x/day |
On a properly matched 30-day basis, perps turn over capital roughly 7x faster than on-chain tokenized equities per day. Despite holding a broadly comparable capital base (perp OI is only ~38% larger than on-chain active mcap - $3.26B vs $2.42B), perp venues moved $105.7B over 30 days, more than 9x the on-chain figure over the identical window.
However, the lack of turnover on-chain doesn’t necessarily mean the market is fake. The more likely answer is that the two markets are built for, and attracting demand for, genuinely different trading profiles.
Perps exist to be traded. A leveraged derivative position accrues funding costs and requires active management — margin rebalancing, rolled positions, funding paid. One can say that high turnover is the mechanical requirement of the product. The $111.4B moved in 30 days is unambiguous evidence that people are actively using these venues as trading instruments, at real scale.
On the other hand, on-chain tokenized equities exist to be held. A wrapped share is functionally closer to a brokerage position than a trading chip. And at 15.5%/day, while modest next to perps, is still decent.
Concentration - Measuring The Playing Field
Metric | On-Chain Issuers | Perp Venues |
|---|---|---|
Entities in scope | 21 issuers | 19 venues |
Top-1 share | 30.26% | 88.5% |
Top-3 share | 77.45% | 96.9% |
Both markets are concentrated, but perps are in an entirely different tier. On-chain issuance sits at the highly concentrated threshold, with the Top-3 gaining 77% market share. Yet the top perp venue has a market share that represents almost 90% of all volume traded via equity perps. This is near-total dominance.
On-chain: Ondo Global Markets and Backed Assets hold 30.26% and 28.57% of scoped mcap respectively ($917.2M and $866M), with bTech (Binance) at 18.62% - three players covering 77.45% of the market.
Perps: trade-xyz alone holds 88% of open interest ($2.9B of the $3.26B total) - essentially one venue is the perp stock market by this measure.
Volume tells a similar but slightly different story. By 30-day volume (rather than size), perp concentration is nearly identical — Trade.xyz still does close to 90% of volume — so its dominance isn't just in open interest. Trade.xyz is where the trading happens.
On-chain volume concentration is heavily two-sided. Of the issuer groups with any tracked 30-day volume, bTech Holdings and Ondo Global Markets alone account for 98.6% of the market (64.8% and 33.8% respectively), with everyone else combined barely registering. Notably, bTech is the smaller issuer by market cap but drives most of the trading activity, probably because it is on Binance, the world’s largest crypto exchange, and is featured as Binance’s on-chain stock solution.
Consistency - Whether activity is steady, or spiked across a few key days
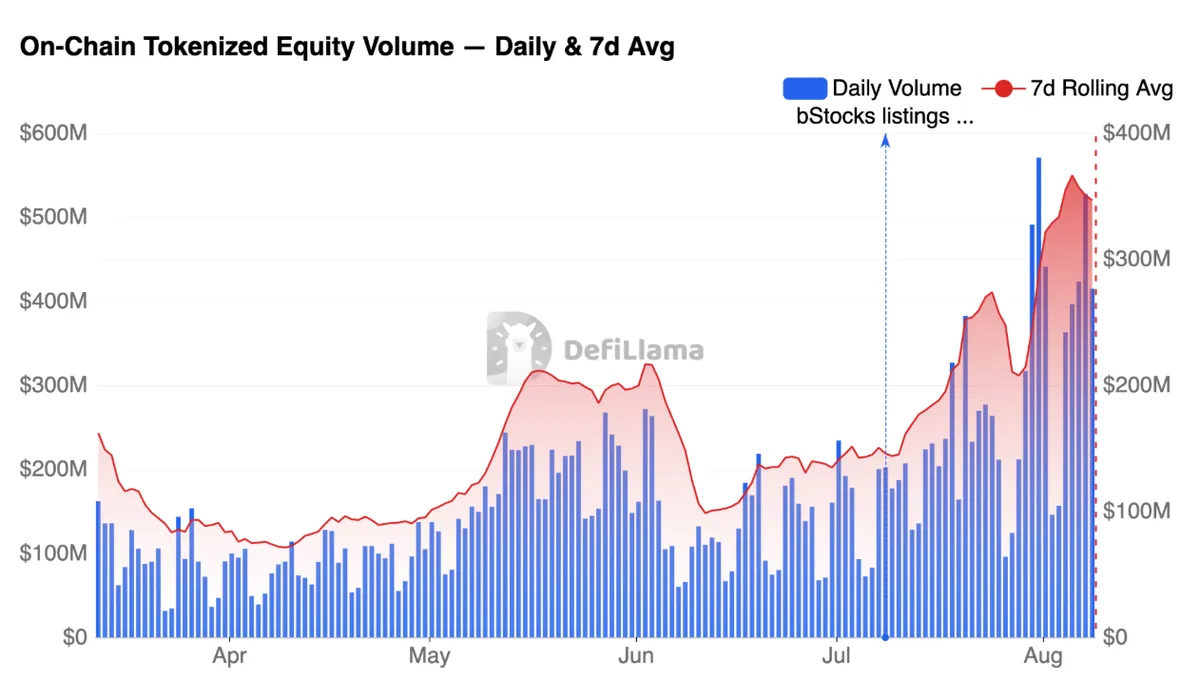
On-chain tokenized equity volumes are choppy from a day-to-day perspective, but the 7-day average line traces a clear staircase upward. The perp volume has the same overall shape, but much bigger swings — the bars are spikier and less even throughout.
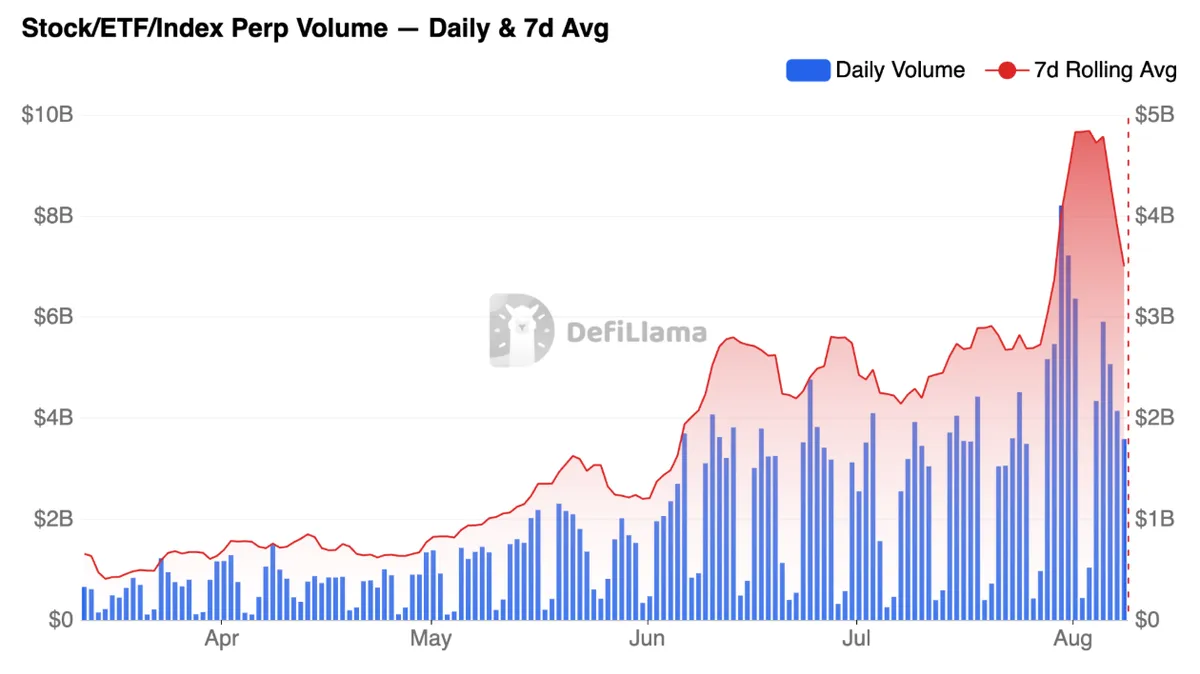
Overall, perps are lumpier day-to-day, but on-chain concentrates into fewer big days. Both markets tell the same underlying story: volume is trending up. The 7-day average on-chain volume roughly tripled from $90-120 million a day in March and April to $330-400 million by early August. Perps show an identical shape at roughly ten times the scale, with the 7-day average rising from $1-1.2 billion a day in March to a peak of $4.86 billion in July. This shows that it’s not a few spike days doing all the work but expansion with some volatility layered on top.
Looking deeper, we can see that half of all perp volume happens in just 31 days out of 150. On-chain takes 38 days to accumulate half of all current on-chain volume. This draws similar conclusions to the concentration section: a few big pairs on both these platforms do outsize volume on certain days.
Concluding Thoughts
For both on-chain and perpetual markets, all the data points to a few conclusions:
Perps are ahead of on-chain tokenized stocks on every measurable dimension of product-market fit. Perps are larger, faster, and spikier. On-chain is smaller, slower, and steadier.
Activity is concentrated in a small number of specific issuers/products for both.
But ultimately, they both seem to have product-market fit, but at different scales. Both rails are real and growing; one faster than the other.
Across four metrics - size, turnover, concentration, and consistency, the data points the same way. Stock perps have more capital at work, that capital turns over faster, and the market is more active day to day. On-chain tokenized stocks are smaller, slower, and steadier. In both cases, you have users showing up and using something actively at scale - but the signal is much stronger for perps than for on-chain tokenized stocks.
However, the difference can be boiled down to the fact that the two markets are not the same thing. A perpetual swap is a trading swap, while a tokenized stock is ownership infrastructure. The perp attracts a user who wants exposure and wants it now — leverage, 24/7 access, no custody of the underlying asset. The on-chain user, however, wants to hold an asset that can sit in a wallet, be used as collateral, or be redeemed. The former user exists at large in the financial markets, while the latter is still growing.
The data supports this. The turnover numbers tell you that on-chain capital turns over ~4.6x every 30 days. Thus, it’s a user base that doesn’t want to trade, but rather is consistent with money that mints, sits, and gets used as exposure or collateral. Perp turnover numbers of ~32x every 30 days is consistent with behavior at a typical trading/speculation venue. So they both have different economic functions — low turnover for a holding instrument, high turnover from a leverage/speculation instrument.
Both are growing,. But for perps, it is quite clear they’ve already reached product market fit. On-chain tokenized stocks, meanwhile, are seeing real, growing capital, but there’s some ways to go before we can conclude that they’ve enjoyed long-term anti-fragile adoption. , they have both shown incredible signs of success from where they began.