Bought, Not Levered: What Actually Drove Bitcoin's August Rally
Bitcoin spent the first eighteen days of August going nowhere, trading between $62,000 and $66,000. On August 19 it broke out, and by the 25th it had touched roughly $81,500. That's close to 27% from the breakout base, one of the sharpest weeks in the past five years.
Binance
BTC
Bitcoin spent the first eighteen days of August going nowhere, trading between $62,000 and $66,000. On August 19 it broke out, and by the 25th it had touched roughly $81,500. That's close to 27% from the breakout base, one of the sharpest weeks in the past five years.
The reflex reading of a move that fast is leverage. However, our data points to something else. Spot volume grew 50% faster than perpetuals, ETF liquidity was already flowing in two sessions before the breakout, and open interest fell in Bitcoin terms even as it rose in dollars. In simpler terms, this rally was bought, not levered.
Which raises the second question. If the move ran on cash rather than leverage, which venues did it run through?
It was bought, not levered
One way to assess whether a rally is spot-driven or leverage-driven is to compare spot and perpetual volumes.

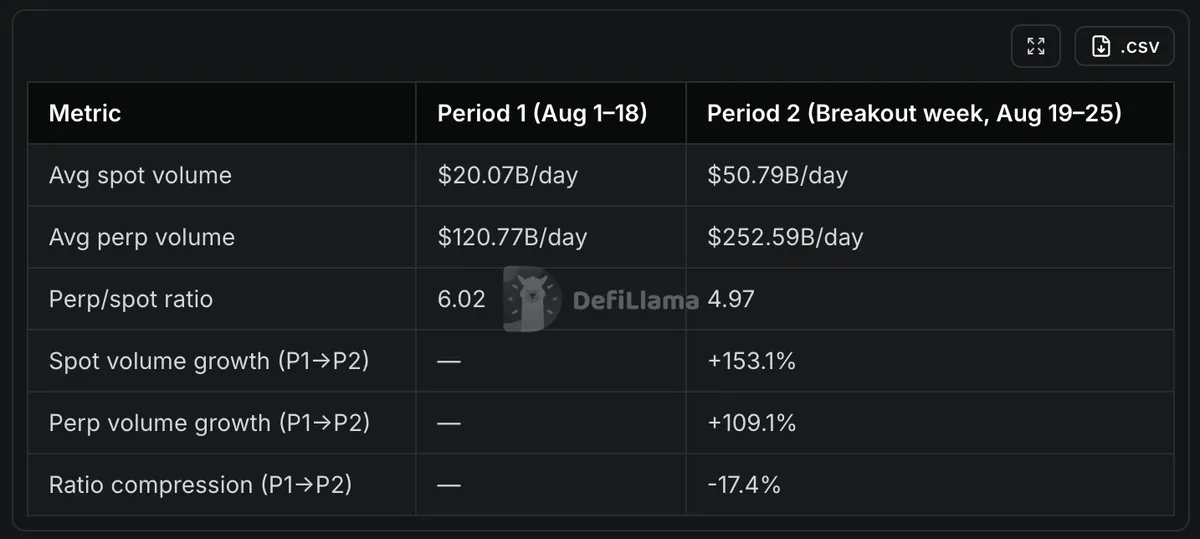
Through the first eighteen days of August, the market traded $6.02 in perpetual volume for every dollar of spot volume. During the breakout week, that ratio fell to $4.97, a 17.4% compression. The reason is straightforward: spot activity accelerated faster than derivatives with the average daily spot volume rising 153% over the period to $50.79 billion, while perpetual volume increased 109% to $252.59 billion. The gap suggests that the breakout was supported by a meaningful increase in spot participation rather than being driven primarily by leverage.
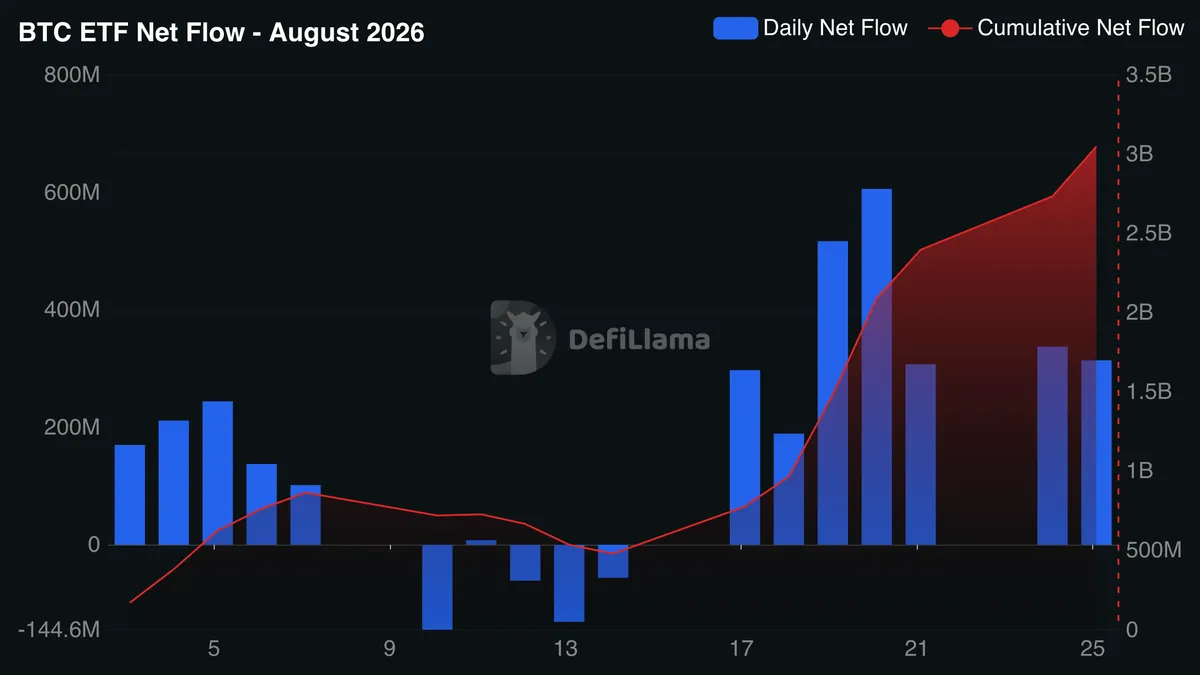
The ETF flows reinforce this observation. US spot Bitcoin ETFs recorded net outflows throughout the August 10-14 week, before reversing with two positive sessions just ahead of the breakout. The shift then persisted: since August 14, there has not been a single session of net outflows. Month-to-date net inflows now stand at $3.05 billion, making ETF demand an important trend to watch over the coming weeks.
As for perpetuals, we can’t ignore that volume nearly doubled over the period, while open interest in dollar terms climbed from about $21.9 billion just before the breakout to a peak of nearly $26 billion on August 24. But measured in BTC rather than dollars, the picture looks different. The market was carrying roughly 341,000 BTC in open positions before the breakout, compared with around 312,000 BTC today, an 8.5% decline.
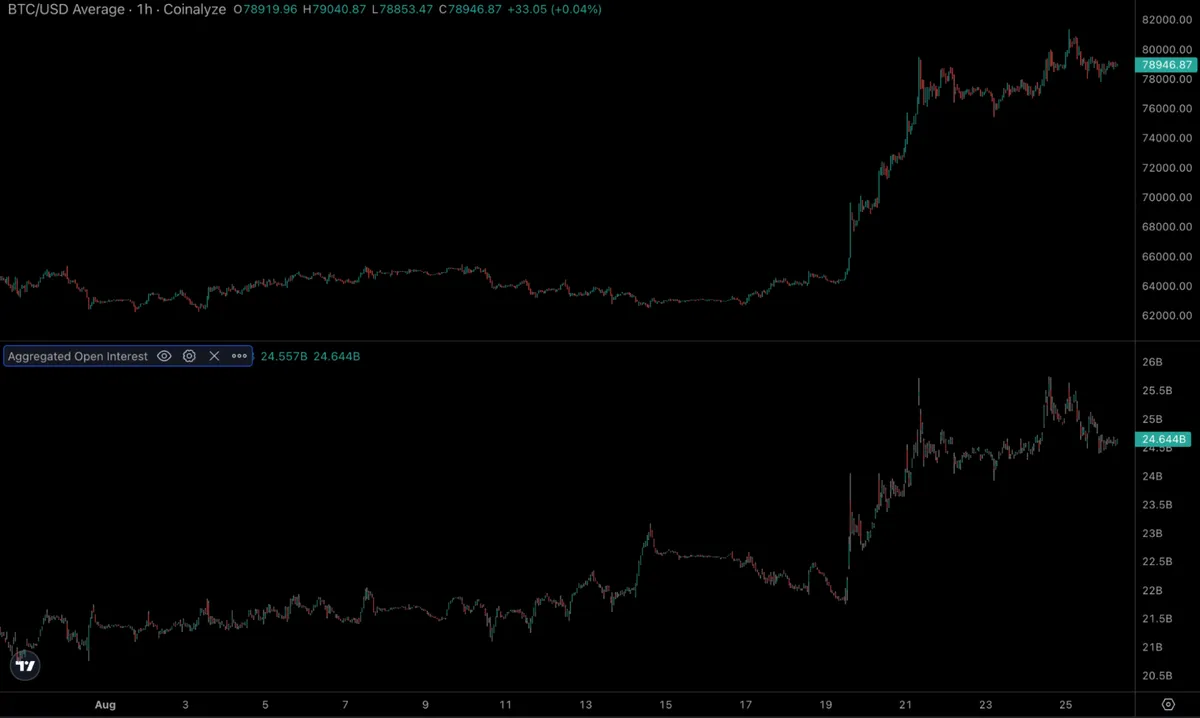
In the end, perpetual trading remained elevated throughout the period, but open interest contracted in BTC terms as prices climbed and spot inflows returned. That combination demonstrates that the rally was supported by fresh capital rather than being driven primarily by leveraged bets. The next question is: who captured those flows?
Who captured those flows?
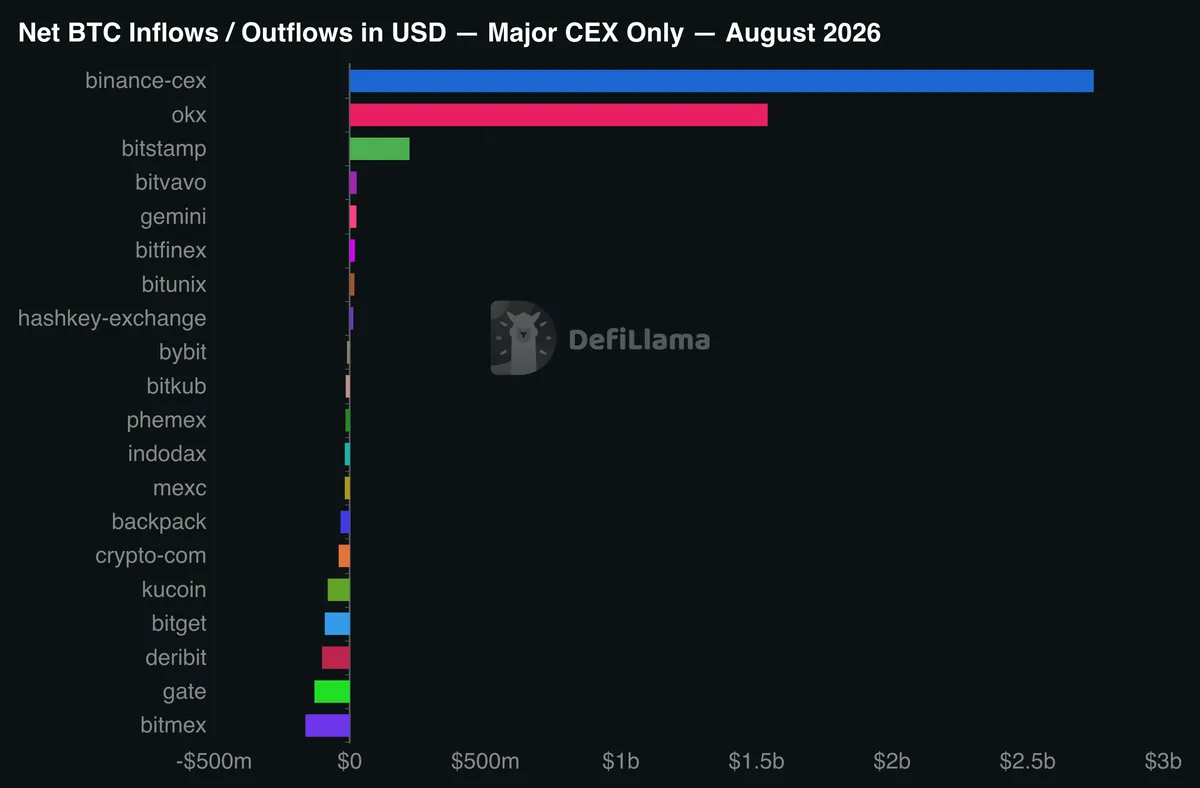
Tracking Bitcoin balances on centralized exchanges gives us a good view of where that fresh capital landed. Here, two venues stand out: Binance and OKX, which captured the bulk of the increase. Binance added $2.63 billion in BTC balances over the same period, double of OKX’s $1.27 billion. To put that into perspective, Binance alone absorbed nearly as much as the entire US spot Bitcoin ETF complex, which recorded $3.05 billion in net inflows over the same period.
Unsurprisingly, those inflows translated into trading activity. Both platforms saw spot volumes surge during the breakout, but Binance stood in a league of its own. Average daily spot volume climbed from $4.75 billion to $13.69 billion, a 188% increase, making it the only tracked exchange to exceed $10 billion a day. OKX operated at a more modest absolute scale, but its 234% growth was the strongest among major CEXs and well above the market average of 153%.
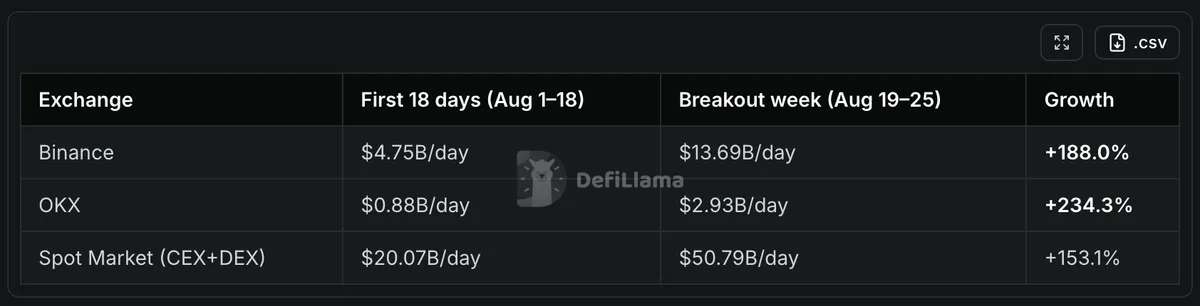
Together, Binance (46%) and OKX (11%) accounted for nearly 57% of the spot volume traded across the exchanges tracked, reinforcing the same picture seen in balances: fresh capital did not spread evenly across the market. Instead, it concentrated around a handful of venues, with Binance and OKX capturing most of both the inflows and the resulting trading activity.
What comes next?
With open interest peaking and then falling, much of the short squeeze seemingly behind us, and liquidity flowing back into the market, what happens next will largely depend on how spot and ETF demand evolves, a conclusion also shared by Binance Research.
That gives traders a clear signal to watch. If open interest starts rising faster than spot volume and the perpetual-to-spot ratio climbs again, the market will have shifted from one driven by fresh capital and more sustainable price discovery to one fueled by leverage again.