Prediction or roulette? Kalshi’s trades are moving to the edges of the price curve
To test this, we looked at two dimensions, cash and flow, across several metrics. Cash tells us where the money goes, and flow tells us where the trades go. Together, they give a clear picture of what Kalshi is becoming.
In late 2025, Kalshi still worked like a classic prediction market. Nearly all of its trades happened on single markets, and the most traded prices sat around 50¢, where an outcome has even odds.
Combos have changed that picture. As we highlighted in our first Kalshi spotlight, notional volume hides how little cash actually enters the platform and in September, a contract implies less than an 8% chance of paying out.
Kalshi has kept adding products and leverage since. Single markets have traded at prices down to 0.1¢ since late July 2026, and combos down to 0.01¢ since September 3. On top of that, 15-minute crypto markets let traders bet on price moves that settle every quarter of an hour. The lower the price, the bigger the payout for the same stake: a combo bought at 0.01¢ pays 10,000x.
That raises a simple question: is Kalshi still a prediction market, or is it becoming a long-shot platform? The data is clear: behavior has changed, and by trade count, we lean toward the second.
To test this, we looked at two dimensions, cash and flow, across several metrics. Cash tells us where the money goes, and flow tells us where the trades go. Together, they give a clear picture of what Kalshi is becoming.
Combos pull in cash faster than trades, while singles do the opposite
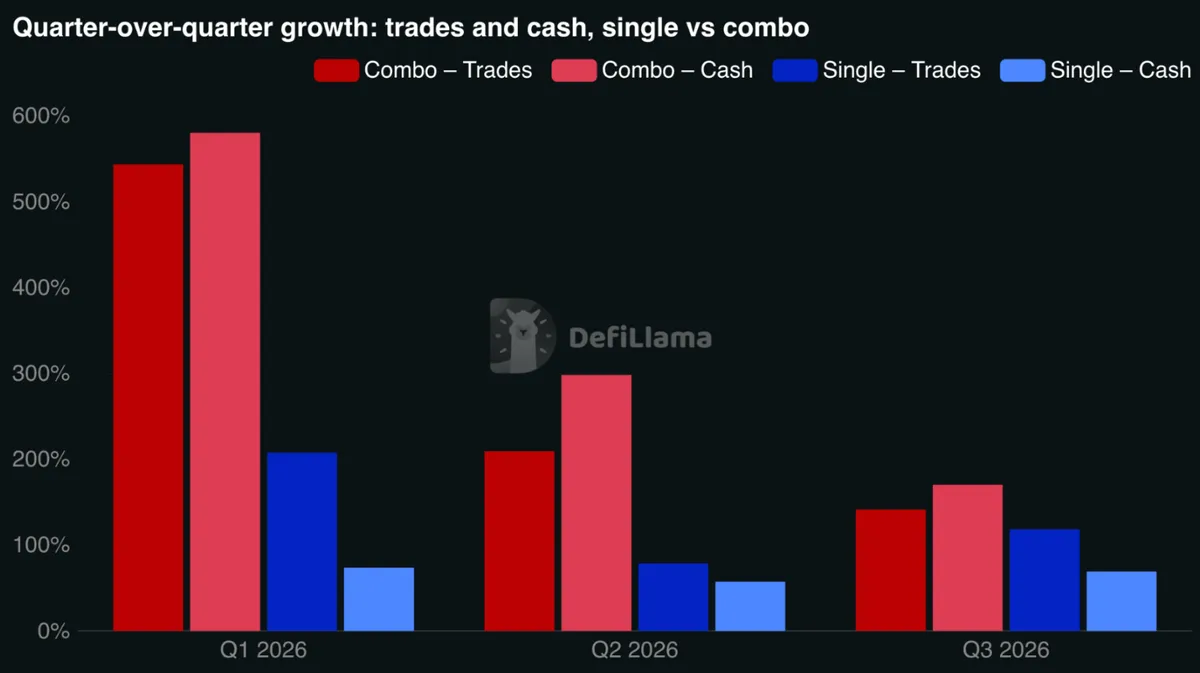
Without surprise both Singles and Combos have grown in both number of trades per quarter and cash per quarter. Though, what is key here is to note that the growth in cash is higher on combos compared to the growth of trades. This is not the case for singles and that hints at something: that not only combos grw in number of cash it also grew in cash per trade while single has grown in trades but they carry less cash.

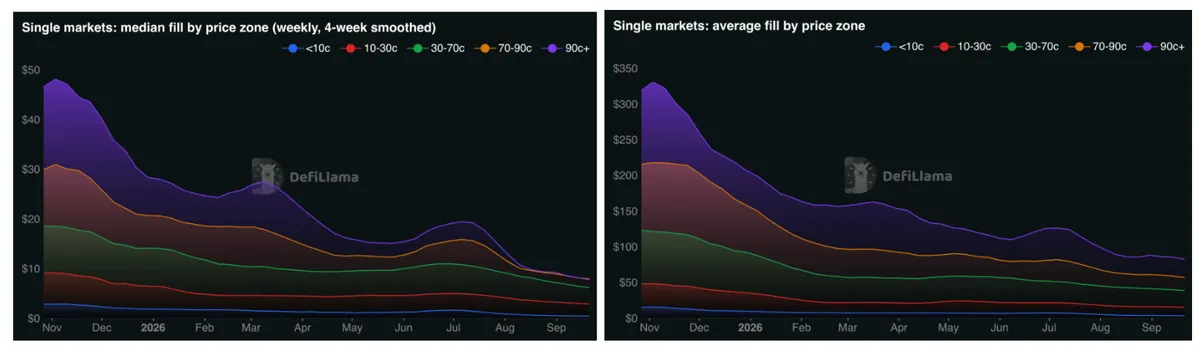
The fill sizes by price zone make this split clear. In single markets, the average fill across all price zones fell from $127.31 in October 2025 to $39.63 in September 2026, and the median fell from $14.78 to $4.59. Both ends of the curve shrank by about three-quarters. At 90¢ and above, the average fill went from $319.62 to $82.81, and under 10¢ it went from $15.62 to $3.82. Single tickets got smaller everywhere, from near-certain outcomes to long shots.
Combos moved the other way. Their average fill rose from $37.78 to $61.69, while the median remained more or less stable around $9.30. The rise came mostly from one end of the curve. At 90¢ and above, the average combo fill went from $202.64 to $512.82. Under 10¢ it stayed at about $12.50 although its median fell from $7.17 to $4.68.
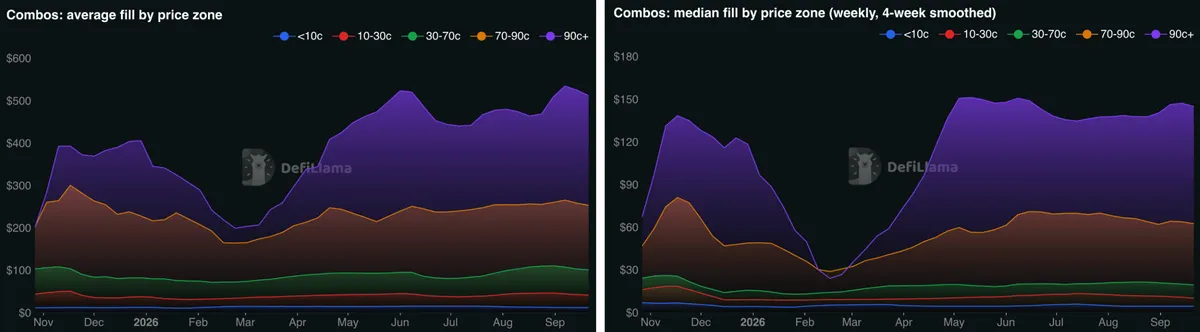
The two moves inverted the balance. A year ago, a combo fill carried less than a third of the cash of a single one: $37.78 against $127.31. By September 2026 it carried more, at $61.69 against $39.63.That’s a striking shift, and it hints at three things.
First, singles keep growing but are losing ground in bettors’ wallets. Single trades grew 19x in a year, yet each one carries less cash, and singles’ share of Kalshi’s cash fell from 99.7% to around 80%.
Second, combo bettors put big money on near-certain outcomes. The heaviest combo fills now sit at 90¢ and above, mostly on the side that bets a parlay will fail.
Third, combo bettors also take more risk at the bottom of the curve. In September, an average combo fill under 10¢ carried more than three times the cash of a single one, at $12.55 against $3.82, despite lower odds of winning.
The lower end: the hidden growth everyone misses under the 10c
Trades priced under 10¢ went from 9.2% of all Kalshi trades in October 2025 to 18.6% in September 2026. Put differently, nearly one trade in five now carries a price-implied chance of success under 10%. In absolute terms, that’s 1.48 million trades in October against 64.2 million in September, a 43x increase while all trades grew 21x.
One step further down, the picture is sharper. Trades under 5¢ went from 4.4% to 12.3% of all trades, or from 0.71 million to 42.5 million. Trades at 1¢ or less, which our data tracks from March 2026, went from 0.5% to 4.3% of all trades, reaching 14.9 million in September.
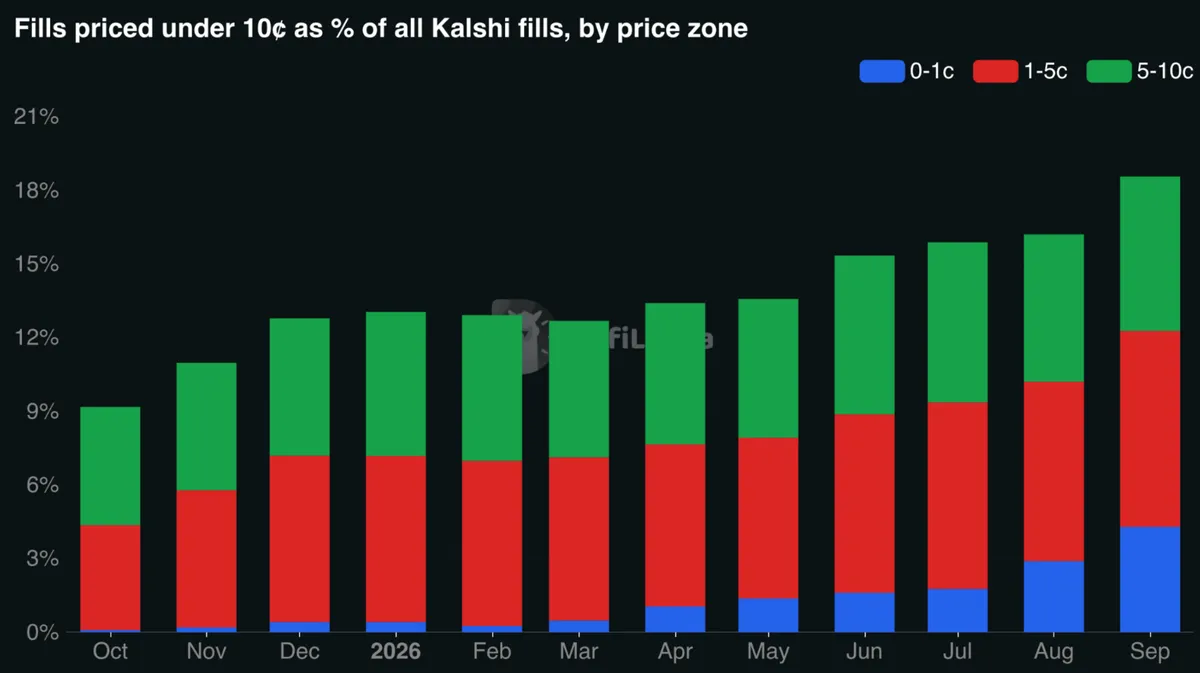
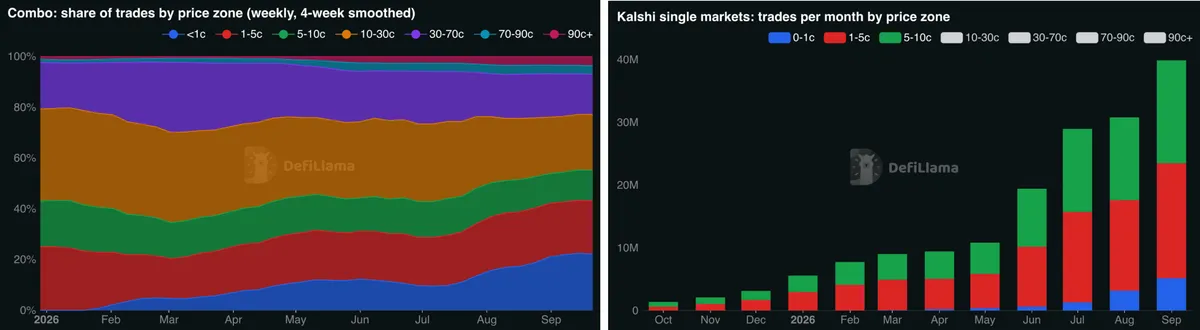
Combos are the obvious suspect. Around 55% of combo trades priced under 10¢ with significant growth in trades at 1¢ or less which went from 6.0% of combo trades in March to 22.0% in September.
Interestingly, Singles move the same way from a lower base. Their under 10¢ share went from 8.7% to 13.2% of single trades, and their under-5¢ share from 4.0% to 7.8%. Trades at 1¢ or less grew from 69,000 in March, or 0.08% of single trades, to 5.2 million in September, or 1.71%.
Put simply, the riskiest end of the curve is growing in both products, for two different reasons.
On combos, the entry price is the main driver. Every leg pushes the price toward zero, and on September 3 Kalshi lowered the floor from 0.1¢ to 0.01¢. The cheapest combos are mostly built on sports legs.
On singles, finer price grids since late July play a part, but the bigger driver is the 15-minute markets and their wave of small, frequent trades. They went live on BTC, ETH and SOL by January 2026 and now cover more than a dozen assets, with gold and silver added on August 3. By September, they made up half of single trades and nearly half of Kalshi’s trade growth over the year.
The higher end: what the 90¢+ growth really is
The cheap end isn’t the only part of the curve that is growing. In single markets, trades priced at 90¢ and above went from 1.2 million in October 2025 to 46.5 million in September 2026, or from 7.5% to 15.4% of single trades. In combos, the same zone went from about 1,400 trades to 1.7 million, or from 0.9% to 3.9% of combo trades. Both products reach this zone for different reasons, and those reasons explain the fill sizes we saw earlier.
On singles, the 15-minute markets again do most of the work. They account for 58% of single trades at 90¢ and above. This is most likely mechanical: as the window closes, the price of the nearly decided side climbs toward 100¢ and trades stack up there. This type of trade largely explains why single ticket size collapsed. Fifteen-minute trades are small, with a median fill of about $2.80, and they now make up most of the 90¢+ zone.
On combos, the 90¢+ zone is almost entirely one trade: buying the NO side of a parlay, which is a bet that it fails. NO buys make up 94% of the zone, with 1.6 million trades in September.
In both cases, the 90¢+ growth is a bet on near-certainty, at the safe end of the curve. On singles it follows the 15-minute product, and on combos it comes from large favorite-side purchases.
Kalshi, still a prediction market?
All of the above shows that, through the design of its products, Kalshi is pushing trades toward the two extremes of the price curve, but not symmetrically. On combos, 14 trades sit under 10¢ for every one at 90¢ and above. On singles, the 15-minute markets push traders either toward a last-minute safe bet that earns a little or toward the life changing long shot.
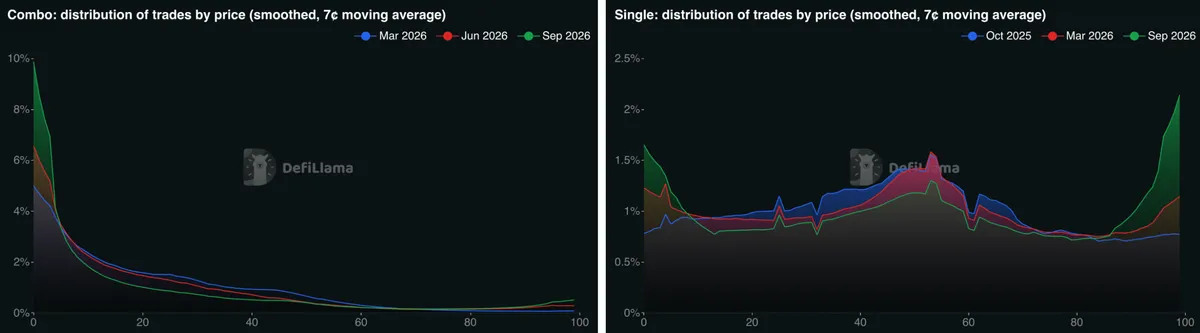
So the answer to our question is clear. Kalshi’s trades say less and less about what people think will happen. Instead, they increasingly answer two other questions, where the safest quick gain lies and which long shot pays the most, and the more trades those questions draw, the less Kalshi looks like a prediction market.
Methodology
This analysis uses Kalshi fills for full months from October 2025 to September 2026. Combos are fills in combo series, and everything else is a single market. Cash is the price the taker paid on the traded side, and notional counts each contract at $1. Price zones use the traded-side price, and the 0–1¢ zone includes fills at exactly 1¢.