Universal Token Ratings: What the First 100 Scores Reveal
Built and powered by DefiLlama and Forgd, Universal Token Ratings is a free, open leaderboard — any project can claim its profile, submit disclosures, and get scored on the same Disclosure x Performance framework covered in this piece.
Forgd
A leaderboard invites a single question: “Who's on top?”
But dig a little deeper into DefiLlama’s Universal Token Ratings. “Who’s on top?” turns out to be the least interesting needle in our data haystack.
Our attempt to define and recognize quality tokens generated surprising insights, to wit: few tokens clear the Disclosure and Performance axes simultaneously; one axis is a far more common bottleneck than the other; exchange access moves the score more than token size; and several of the lowest scores reflect missing data rather than failing grades.
Before we get to the numbers, a quick reminder: Disclosure and Performance are each scored 0 to 10. The overall score is their product, 0 to 100, not their average and not a percentage. A token scoring 7 out of 10 on both axes lands at 49 out of 100, not 70.
It’s lonely at the summit
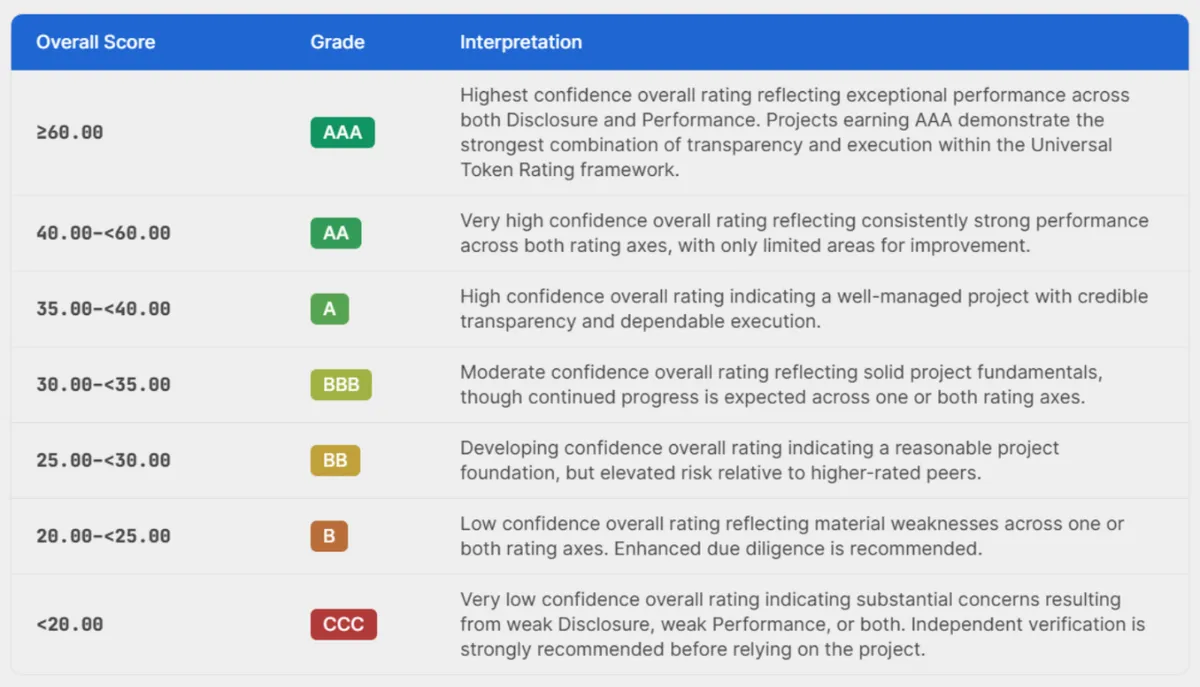
Only one token in the rated universe earned AAA, and its score is 60.6 out of 100. That's the multiplicative structure of UTR at work: reaching AAA requires a token to score highly on both axes. Strength on a single axis isn’t enough to lift a token to the top grade.
Across the full set:
→ 1 token at AAA → 24 at AA → 17 at A
→ 26 at BBB
→ 25 at BB
→ 12 at B
→ and 23 at CCC.
Rated tokens earned a mean score of 30.6 out of 100. The lowest-rated token earned a score of just 5.6 while the highest, as mentioned above, earned 60.6.
Disclosure and Performance scores are built from several weighted sub-criteria, so closing the distance from, say, 7.75 to a perfect 10 would mean eliminating weaknesses across the entire framework at once. That’s why a 100 is expected to stay rare no matter how large the rated universe grows. (For more information on how UTR scoring works, visit the documentation or check out this article.)
Disclosure is the true bottleneck
Token performance takes care of itself. Once a token trades, its liquidity, spreads, and volume sit on public venues. What happens next is largely outside the team’s control.
Disclosure works the other way. A project has to actively publish a vesting schedule, name its multisig signers, name its market maker, and then keep all of that information current as facts change. Points in the Performance axis accrue automatically. Earning points in the Disclosure axis requires ongoing paperwork somebody has to actually do.
The data reflect that. For three out of every four rated tokens, the Disclosure axis weighs on their total score. Rated tokens’ mean Disclosure score sits at 4.98 out of 10. Their mean Performance score sits at 6.07. And the correlation between the two axes is weak (0.24), meaning a project doing well on one tells you little about how it does on the other.
One caveat to the Disclosure-as-albatross finding: the two lowest-scoring sub-categories in the system are on the Performance side. In the Market Makers sub-category, rated tokens earned a mean score of 0.95 out of 10. In the Performance-side Tokenomics sub-category, they earned a mean score of 4.22.
But this has little impact on total scores. That’s because this data was relatively hard to gather across the board. Market maker data weren’t available for 88% of rated tokens. Buyback, burn, and inflation data weren’t available for more than 70% of rated tokens. In the UTR, an unmeasured criterion defaults toward zero rather than being excluded from the average. These category scores read low mainly because the underlying data isn't there yet, not because projects are failing the test.
If anything, that downward bias weighing on the Performance side makes the Disclosure finding more robust — even though most tokens’ Performance scores suffer an artificial penalty, their Disclosure scores still emerge as the primary burden.
Big, or broad?
Exchange listings have an outsize impact on the Performance axis. Liquidity depth, spreads, and trading volume are, of course, measured on the venues where a token trades, and getting accepted onto trading venues takes ongoing work from a project. In other words, Binance won’t alway onboard a new token just because it has a large valuation.
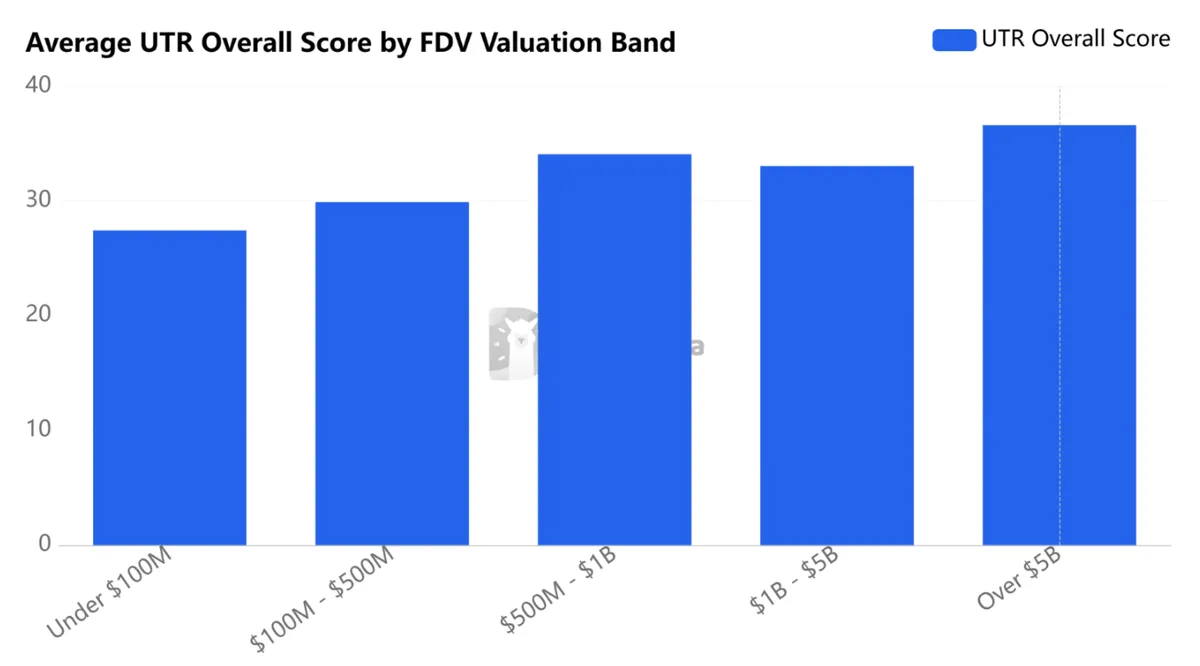
In fact, valuations barely impact the UTR score, appearing only once, as a single input inside the Tokenomics sub-criteria. That means a token can carry a billion-dollar valuation and still register as thin on the exchanges we use to measure token performance.
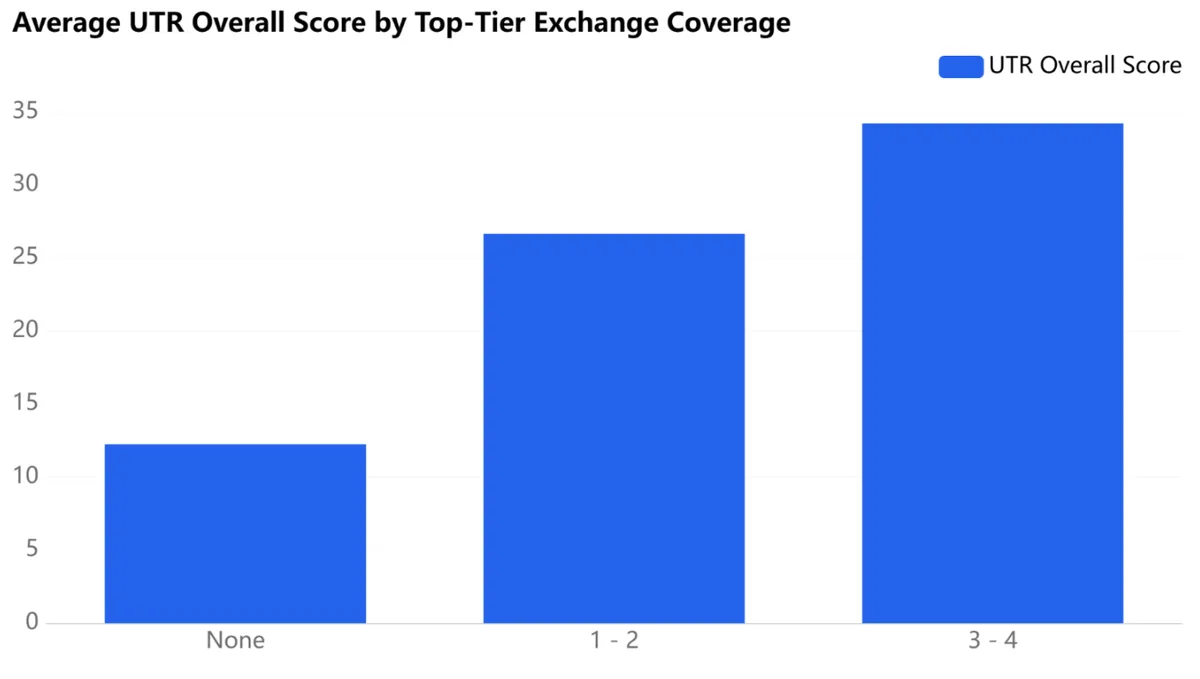
That shows up clearly in the averages. Moving from the smallest valuation band to the largest lifts the average score by only 9.2 points out of 100. Moving from zero top-tier exchange listings to three or four lifts it by 22 points, more than twice as large a swing, and that difference sits entirely in how widely a token is listed rather than its market capitalization. Of the 128 rated tokens, 9 carry no top-tier listings at all, while 57, nearly half the universe, carry all four tracked.
What that means in practice: a token's UTR score currently says more about how widely it has reached recognized trading venues than about how much it’s worth. A large, well-funded token with narrow exchange coverage will score closer to a small, thinly-traded one than to a token that has landed broad distribution, because the score puts a premium on reach, not size.
Of course, it can be difficult to disentangle the two criteria — larger tokens tend to also carry more exchange listings, so this shows two real patterns side by side, rather than a controlled test isolating one from the other.
Sector patterns, with a big caveat
Here’s the average overall score by sector: lending, real-world assets, and DeFi-spot tokens lead with a mean score of 36.0 (32 tokens), followed by perpetuals-DEX at 34.7 (7 tokens), and privacy at 34.7 (6 tokens). Infrastructure, the largest sector with 66 tokens, sits at 28.1. Artificial intelligence follows at 27.2 across 16 tokens. The single rated launchpad token earned a score of 26.9.
Lending, RWA, and DeFi-spot tokens earned their lead with robust Disclosure practices — they had a mean Disclosure score of 5.71 out of 10, the best of any sector.
Infrastructure and AI tokens were competitive in the Performance axis but suffered due to their lackluster Disclosure scores.
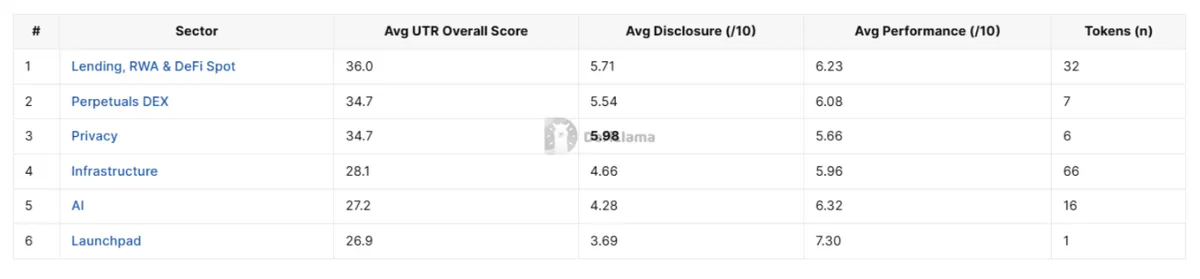
We shouldn’t draw too many conclusions regarding privacy, perpetuals-DEX, and launchpad tokens given their small sample sizes. The launchpad "average" is one token's score, not a sector pattern. Infrastructure and lending-RWA-DeFi-spot are the only two sectors with enough tokens to support a sector-level claim with any confidence.
Low score ≠ bad token (yet)
Some data remains difficult to gather, and that weighed on tokens that might have otherwise earned decent scores. Market maker uptime and SLA adherence was unmeasured for 89% of rated tokens. Market maker volume share and depth share were both around 88% unmeasured. Buyback and burn events was 79% unmeasured. Annualized inflation, 70% unmeasured. Disclosed versus actual vesting was the easiest thing to measure, yet we were unable to gather that data for 34% of rated tokens.
An unmeasured criterion defaults toward zero rather than being dropped from the average. That means a low score in these specific categories today reads closer to "not yet disclosed or trackable" than "measured and found lacking."
That gap should close as more projects claim their profiles and formally disclose market maker relationships get formally disclosed.
In a way, it’s a reminder of the reason we built the UTR. Yes, it’s meant to help people navigate the treacherous world of token investing. But it’s also meant to force teams to do better, to disclose more. It’s meant to help the industry clean up its own act. One more FTX and crypto entrepreneurs might pine for the days of Gary Gensler and the Biden Administration.