Are Prediction Markets Still Hot?
It is clear that the observable universe of prediction markets on DefiLlama converges to these two companies taking most of the pie. However, while they were once neck to neck, Kalshi has blown far past Polymarket and overtaken them as volume leader.

According to Google Trends, searches for Prediction Markets peaked in March, and the latest data shows a decline — from 86 points in July, to 36 points in August.
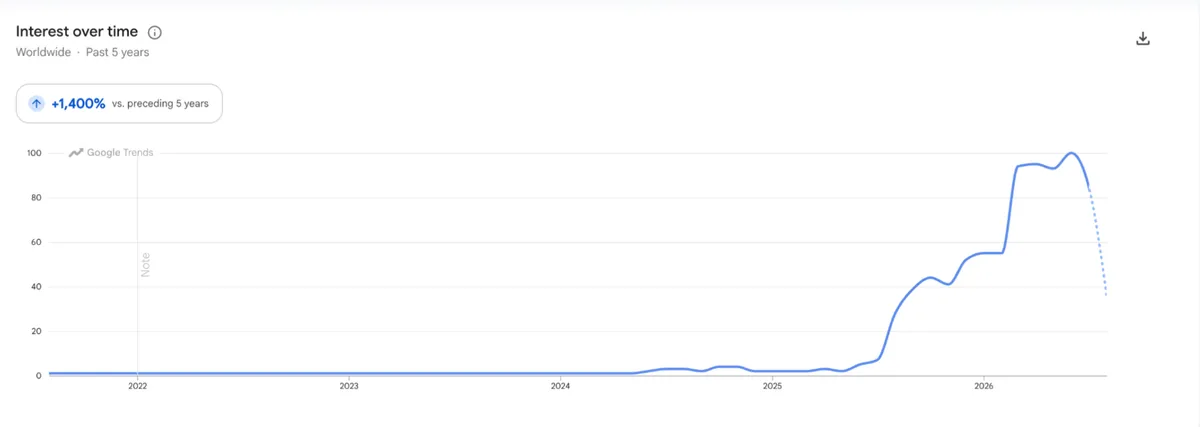
That being said, Google Trends is not the most reliable indicator of growth. At best, it is a good barometer of retail sentiment for certain topics, but a singular data point does not give much information about the state of prediction markets today.
But it does send a signal that prediction markets are no longer front-and-centre of people’s attention. Anecdotally, there does seem to be a slow-down in the coverage of prediction markets in day-to-day news, with artificial intelligence news dominating tech coverage.
Where The Category Stands Right Now
A quick note before diving in: DefiLlama doesn't track fees, revenue or TVL data for Kalshi or Polymarket US — only trading volume. Only Polymarket International has fees/TVL tracked. So wherever this piece cites fees or TVL for 'the category,' that number is Polymarket International. For genuine comparison across all three, we use volume. 'Polymarket' means International + US combined.
Second note: This piece is also missing prediction markets that live entirely outside crypto and DeFi. Robinhood (Rothera exchange), Interactive Brokers (ForecastEx), and CME Group have all launched their own regulated event-contract products in the past year. They’re all off-chain, hence none of them are tracked by DefiLlama. We talk about them later, but most of this piece will centre around the crypto-native corner of prediction markets.

Today, on DefiLlama, there are 116 prediction market protocols carrying a combined $424.2 million in deposited value — though that figure is really just Polymarket International's TVL, since neither Kalshi nor Polymarket US have TVL tracked. Over the past 30 days, these protocols generated $38.0 million in fees, down 22.4% from the month before — again, that's Polymarket International standing in for "the category."
Despite there being over a hundred prediction markets, this category is heavily concentrated. Kalshi and Polymarket (International + US combined) account for 94.7% of all trading volume — Kalshi alone is 70.1%, Polymarket combined is 24.6%. Polymarket International generates 86.5% of category fees (again, the only fee-tracked venue).
Add Predict Fun and Opinion, and four names cover 98.3% of the market by volume. The remaining 100+ protocols — the long tail — make up 1.65% of volume and about 4.3% of fees combined. So for the rest of this piece, we'll track the top 10 protocols by name and bucket everything else as "Other."
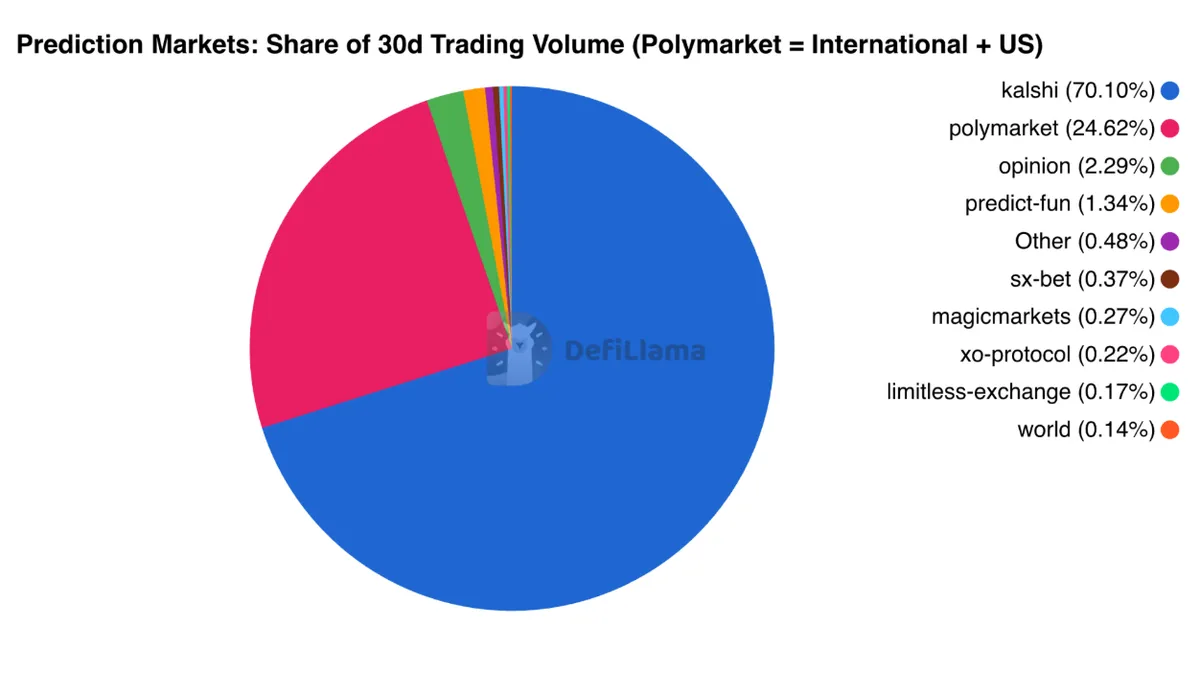
Polymarket International alone generates 86.5% of category fees — remember, that's fees for International only, since neither Kalshi nor Polymarket US have fees tracked at all. On volume, Kalshi alone is 70.1% of the category, and Polymarket (International + US combined) is 24.6% — together the two account for 94.7% of all trading volume. That's the shape of this market: two winners, and a long tail that doesn't move the needle.
Prediction Markets Have S-Curve Growth
The growth of Prediction Markets is nothing short of exhilarating. To compare accurately, we will be using Monthly Volume, which includes Kalshi and Polymarket (International + US combined) — and what you find is one of the most dramatic growth curves in all of crypto this year.
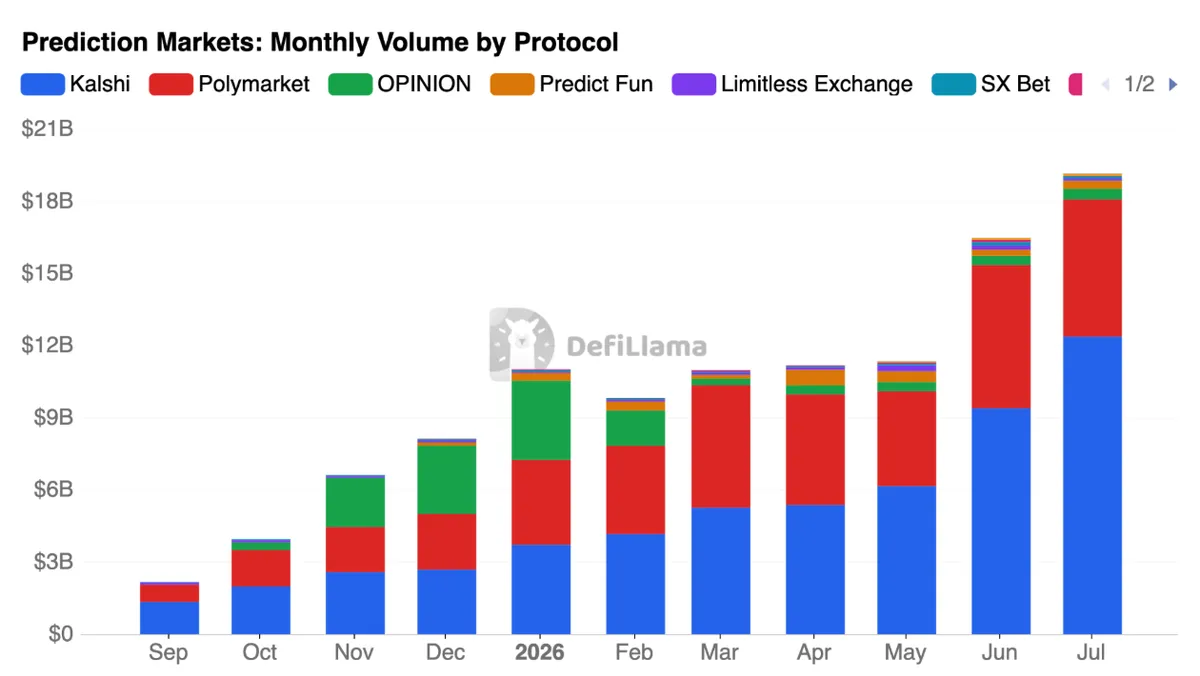
Two things can be true — Prediction Markets are seeing a slump right now, but also had a huge growth spurt in the past 14 months back to July 2025. Monthly volume started at just $955M, climbing to a high of $19.06B in July 2026, an increase of over 1,900%. This wasn't a slow, steady climb either — volume rose for six straight months at its own fastest pace (July 2025 through January 2026), punctuated by the occasional pullback along the way.
In the earliest months, Polymarket's bar is the tallest — it was the default leader before the category had real competition. Kalshi's slice starts smaller but grows every month, and by September 2025 its bar overtakes Polymarket's for the first time. From there, the two stay close for a stretch — before Kalshi's slice pulls decisively away in 2026. By the most recent complete month, Kalshi's bar is roughly 2.85x the size of Polymarket's combined bar.
As for other prediction markets, OPINION had $0 volume for Jul–Sep 2025, then jumped to $313M in October 2025 when it went live. OPINION's rise was dramatic: it briefly overtook both Kalshi and Polymarket to become the #1 volume venue in December 2025, before slipping to third place the very next month and then collapsing to a fraction of its peak. It has since been roughly flat at around $370–440M/month from April onwards.
Everyone else in the top 10 is well behind the top 3 — Predict Fun peaked in April 2026 ($647M) and is now 48% below that; Limitless peaked in May ($251M) and is down 66% from peak; SX Bet, xo-market, PancakeSwap, and myriad-markets are all smaller and mostly declining month-over-month.
Prediction Markets Are Slowing Down Today
Then came the peak, and the comedown. July 2026 marks the high point of the entire tracked history, and every day since has been a step down from it. Looking at August's pace — 30 complete days in — Polymarket International's daily fee rate is running 23.1% below July's, and category-wide volume is trailing behind its own peak too.
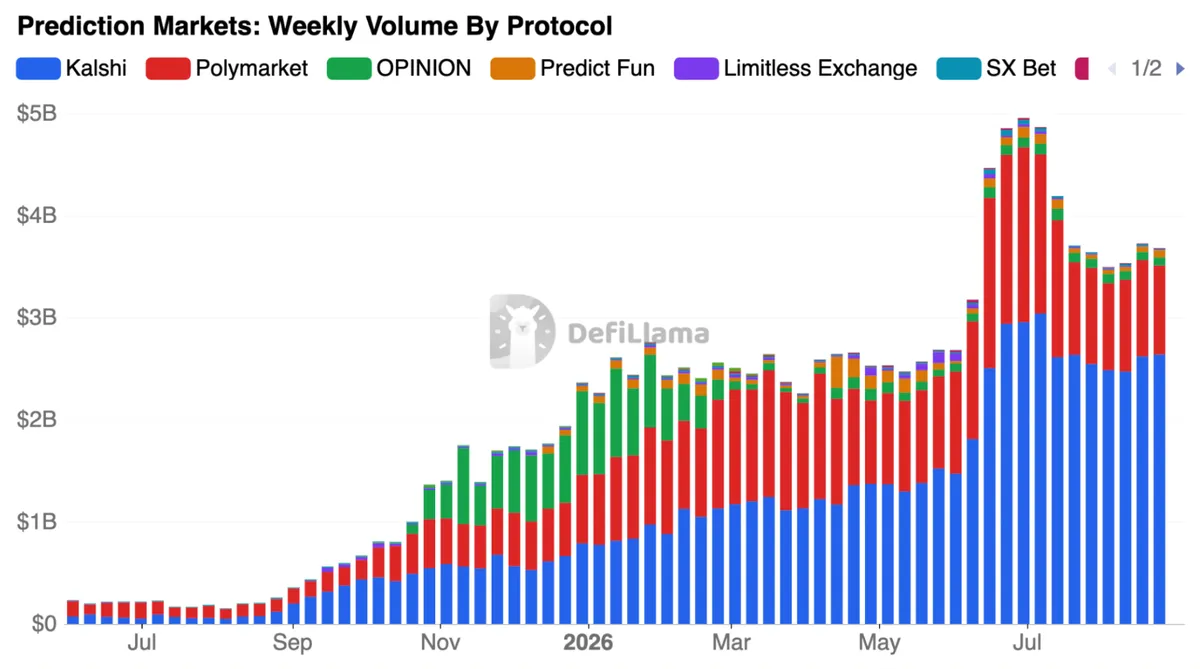
Zooming into weekly data across all tracked prediction-market protocols, category-wide volume peaked the week of June 29, 2026, at $5.01B, and by the week of August 24 had fallen to $3.72B — down 25.8% from that high.
But the leaders aren't slowing at the same speed. Kalshi's weekly volume peaked the week of July 6 ($3.04B) and has eased off by 13.2% since — a real pullback, but a mild one.
Polymarket (International + US combined) has had a much rougher stretch: its weekly volume peaked the week of June 29 ($1.71B) and has since fallen 49.0%, to $873M by August 24 — nearly 4x the size of Kalshi's drawdown. If you looked at Polymarket International alone (the old methodology), the picture looks even worse — down 55.9% from its own June 29 peak — so combining in the US arm actually makes Polymarket's real drawdown look slightly less severe than the old piece implied, not worse.
So it appears the category is both growing and shrinking, depending on the timeframe. Zoomed out, one of the steepest adoption curves around; zoomed into the last two months, a clear pullback from a spike. Prediction markets grew explosively into a July peak and have spent the following weeks correcting off it. Kalshi's trading volume has held up noticeably better through this pullback than Polymarket's has.
Kalshi Vs Polymarket
It is clear that the observable universe of prediction markets on DefiLlama converges to these two companies taking most of the pie. However, while they were once neck to neck, Kalshi has blown far past Polymarket and overtaken them as volume leader.
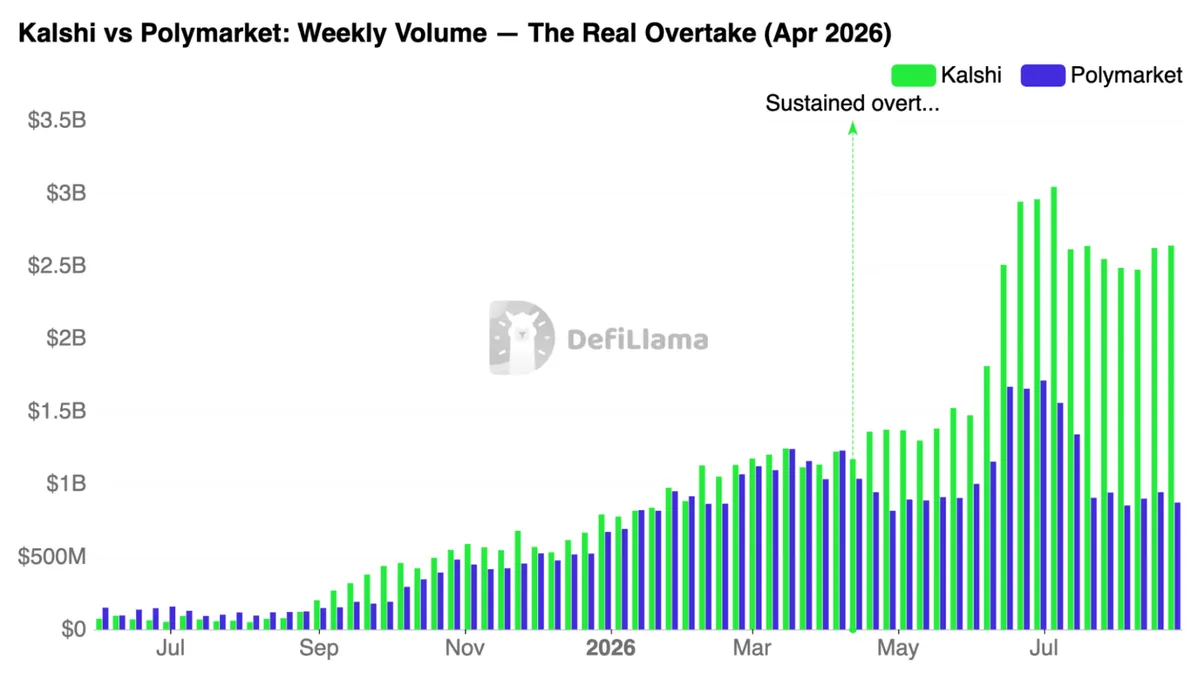
Kalshi first pulled ahead of Polymarket (International + US combined) in September 2025 — by monthly volume, $1.34B vs Polymarket's $718M — after Polymarket had led every month prior.
But that first crossover didn't settle anything right away. For the next seven months the two stayed genuinely close, trading the lead back and forth — Polymarket regained the edge in the weeks of January 12, February 2, March 23, and April 6, 2026. It wasn't until the week of April 13, 2026 that Kalshi's advantage became durable: from that week on, its lead never dropped again.
Week | Kalshi lead (Polymarket = Intl + US) |
|---|---|
Apr 13 (the overtake week) | +12.9% |
Apr 27 | +68.3% |
May 25 | +68.4% |
Jun 22 (World Cup) | +77.7% |
Jul 20 | +191.1% |
Aug 17 (latest) | +177.6% |
By monthly volume, the gap by mid-2026 was stark: Kalshi did $12.37B in July 2026 against Polymarket's combined $5.70B — a gap of about 2.2x. The reason for this can be attributed to Polymarket’s mistakes, and Kalshi capitalizing on the opportunity:
Why Polymarket lost the lead in April 2026:
Polymarket first fee change: Late March 2026, Polymarket added trading fees to almost all markets for the first time — its first-ever broad monetization change.
The market noticed immediately: Bloomberg reported April 22, 2026 that Polymarket had "lost its prediction-market lead" amid a "growing list of operational stumbles" reaching US customers, testing the patience of its own investor, Intercontinental Exchange.
Its fix came too late: an infrastructure upgrade meant to resolve chronic failed transactions and bugs was delayed and didn't ship until April 28, 2026 — after the overtake had already happened.
New legal pressure landed the same month: Wisconsin's Attorney General filed lawsuits in April 2026 against Polymarket (and Kalshi) alleging state gambling-law violations, adding to the regulatory cloud specifically around Polymarket at that time.
All of this led to measurable results — Polymarket's monthly volume fell 12.5% in April 2026, to $4.45B (International + US combined), while Kalshi rose 2.2%, to $5.37B. The slide continued into May, with volumes falling for a second straight month — which the company itself attributed to ongoing "technology maintenance" and a disruptive migration to a new settlement token, Polymarket USD.
And once Kalshi had the lead, several factors helped it hold and widen the gap through the World Cup (June–August):
Regulatory head start: Kalshi is CFTC-registered and has been since inception. Polymarket is split — its newer US arm is now CFTC-registered too (since Nov/Dec 2025), but its original, much larger international platform is not, and still nominally bars Americans despite significant US usage.
CFTC investigation on Polymarket in June 2026: just as the World Cup was heating up, CNBC reported the CFTC had an extensive, ongoing investigation into Polymarket, triggered by a Wall Street Journal exposé into a misleading marketing campaign the company ran.
Kalshi kept winning its own regulatory fights: it wasn't spared scrutiny either — facing state-level lawsuits and blocks in New Jersey, Nevada, Michigan, and Ohio over its sports contracts. But it kept winning the actual legal argument, with federal courts siding with Kalshi and the CFTC's position that federal law preempts state gambling rules — culminating in a Minnesota judge blocking that state's prediction-market ban days before the World Cup final, explicitly agreeing Kalshi's sports contracts fall under CFTC oversight, not state gambling law.
To top it all off, Kalshi's volume mix already skewed heavily toward sports before the tournament, so a global sporting event landed squarely on its home turf — Bank of America pegged Kalshi's share of regulated prediction-market volume at 80% in June, rising to 83–91% through the tournament and into August, with Polymarket around 7%.
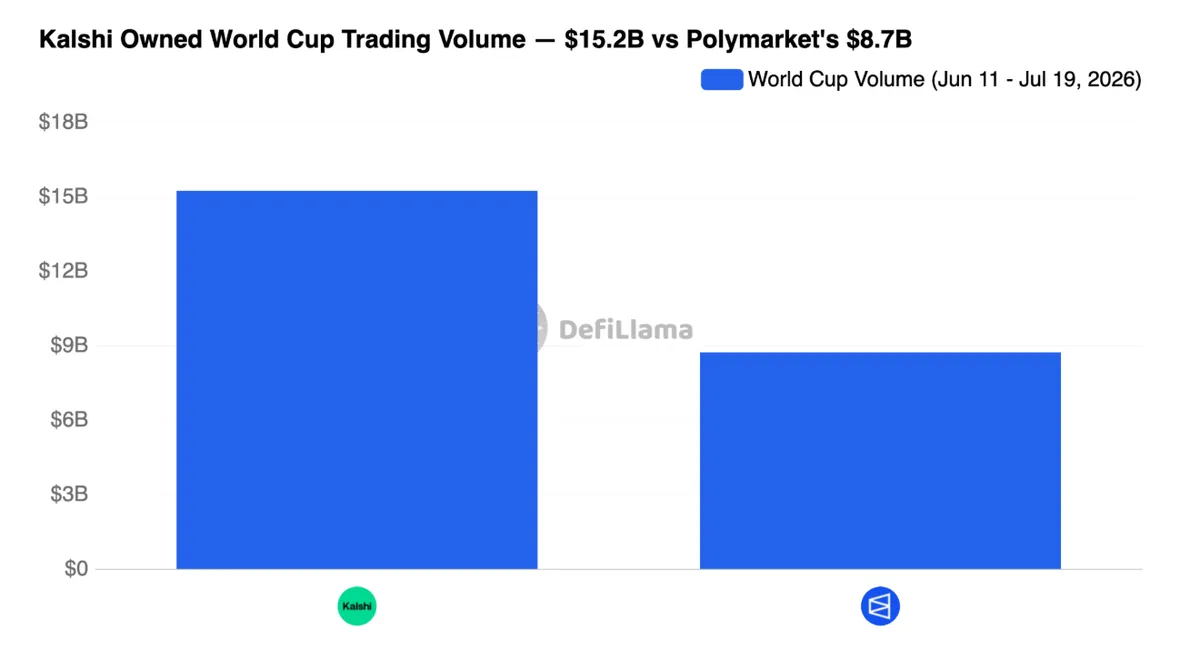
With their heavy marketing push during the World Cup, with World Cup-specific ad spend and sign-up bonuses, all of this culminated into the World Cup in which Kalshi dominated. During the World Cup window (June 11 – July 19, 2026), Kalshi pulled in $15.23B in trading volume compared to Polymarket's combined $8.72B (International + US) — a gap of roughly 1.75x. Combined, the two platforms processed $23.96B over the tournament, with Kalshi capturing about 63.6% of that total and Polymarket the remaining 36.4%, underscoring just how lopsided the World Cup period was in Kalshi's favor even as both platforms saw a genuine volume surge from the tournament.
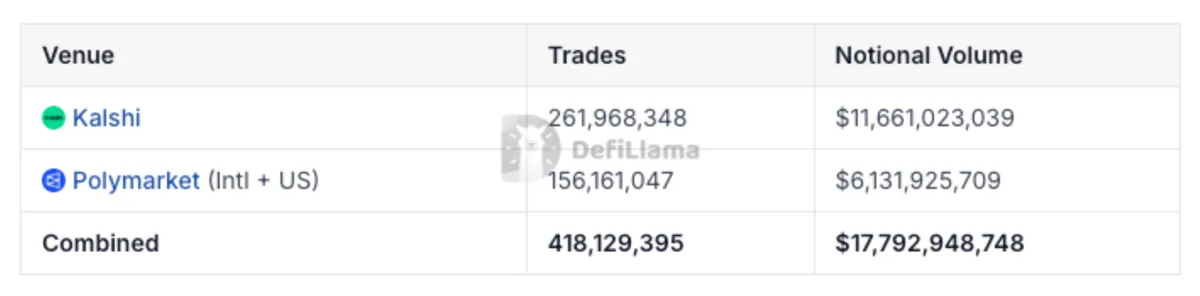
Overall, over the last 30 days, Kalshi runs about 1.68x more trades than Polymarket (combined) and does about 1.9x more notional volume.
What Are People Betting On?
Now that the landscape and growth of prediction markets have been confirmed, it's time to dive deeper into what people are betting on. Breaking down the last 30 days of Polymarket (International + US combined) and Kalshi trading by category, and the picture is blunt: this is a sports and crypto market. Sports alone accounted for $9.33B of the combined $17.84B in categorized volume — 52.3% of everything traded, and add crypto-price markets at $4.38B, just these two categories cover 76.9% of all volume.
Last 30D of Polymarket and Kalshi Trading By Category


Category | Polymarket (Intl+US) | Kalshi | Total | % of Total |
|---|---|---|---|---|
Sports | $3.30B | $6.03B | $9.33B | 52.3% |
Crypto | $856M | $3.53B | $4.38B | 24.6% |
Combos | $123M | $1.50B | $1.62B | 9.1% |
Esports | $1.30B | $191M | $1.49B | 8.3% |
Macro/Rates | $87M | $268M | $355M | 2.0% |
Politics | $112M | $105M | $217M | 1.2% |
Geopolitics | $165M | $0 | $165M | 0.9% |
Science/Tech | $104M | $45M | $149M | 0.8% |
Entertainment | $66M | $32M | $98M | 0.6% |
(unmapped) | $27M | $0.1M | $27M | 0.1% |
Other | $0.05M | $0 | $0.05M | 0.0% |
Total | $6.14B | $11.70B | $17.84B | 100% |
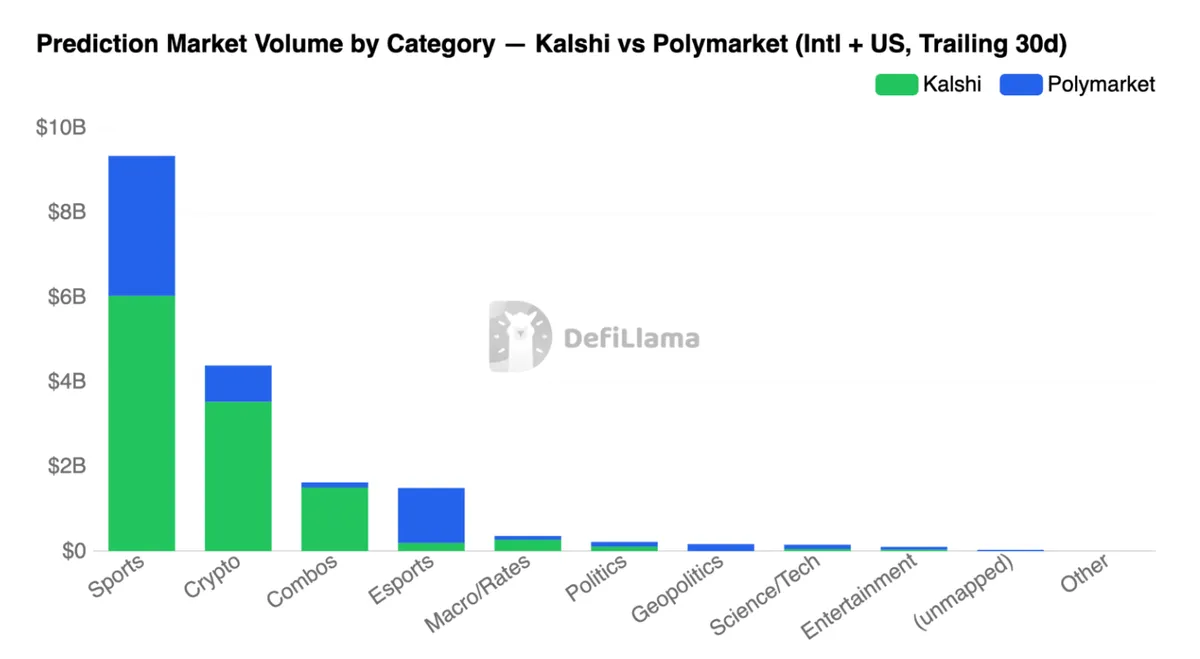
The table shows some interesting points:
Kalshi is 51.5% Sports vs Polymarket at 53.8%. Both platforms seem to be dominated by Sports.
Politics, geopolitics, macro/rates, entertainment, and science/tech — the categories that get most media coverage — still do under 6% of volume combined.
Esports is 21.1% of Polymarket's volume but only 1.6% of Kalshi's — there is a structural gap between Polymarket and Kalshi in this regard.
Combos are 12.8% of Kalshi's mix vs just 2.0% of Polymarket's - Kalshi leans much harder on bundled-product structures.
Geopolitics is 2.7% of Polymarket's volume and literally 0% of Kalshi's — Kalshi doesn't run a geopolitics book at all.
Overall, Kalshi captured 64.6% of all sports volume and 80.5% of all crypto-price volume in the category split. Polymarket, by contrast, still punches above its weight in esports (87.2% of that category), science/tech (69.9%), entertainment (67.5%), and politics (51.5%) — categories that are individually small, but where Polymarket still leads.
Top Markets On Kalshi And Polymarket
A quick note on methodology before the numbers: Kalshi lists many of its markets as recurring products — a fresh contract is created and expires every few minutes or every game, under one shared ticker. Polymarket's markets are mostly standalone, one-off contracts. Comparing a Kalshi product total against a single Polymarket market isn't apples-to-apples, so the two are broken out separately below.
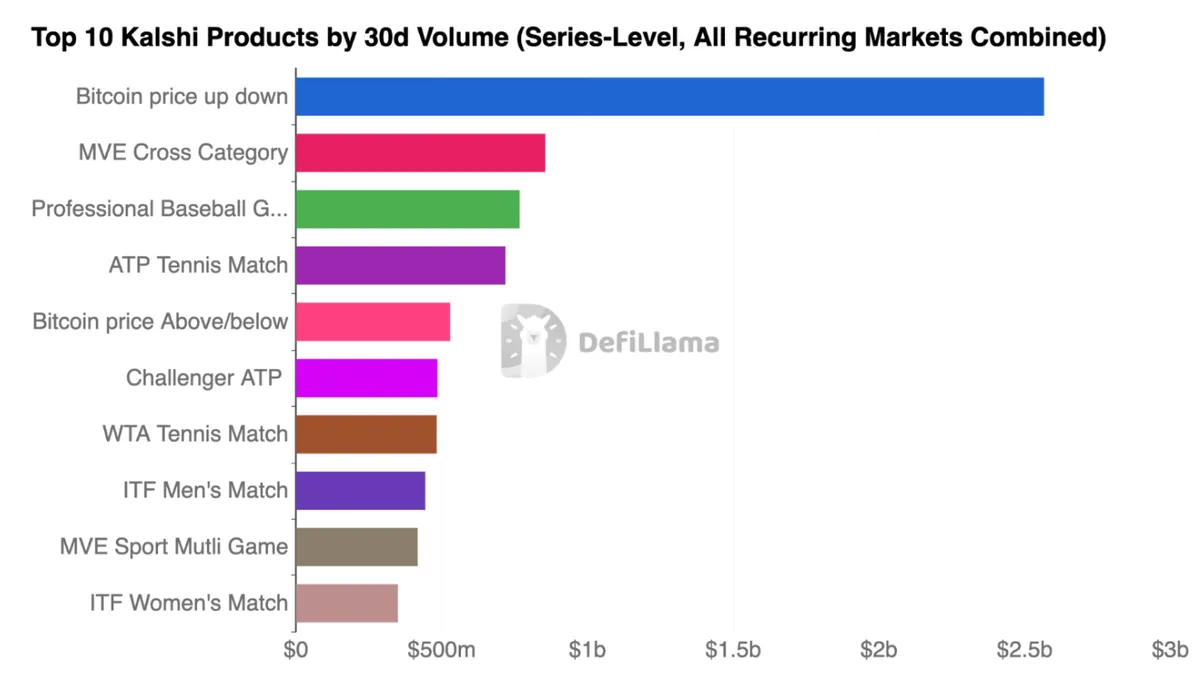
Zooming into individual market types and we get even more granular. On Kalshi, the single biggest market type over the trailing 30 days was Kalshi's 15-minute Bitcoin up/down contract, at $2.57B in notional volume across 70.1M trades, from 2,845 separate 15-minute markets over the trailing 30 days.
That's more than 3x the next-biggest product (Combos, $855M). Combos products — Kalshi's multi-game and cross-category bundles — also crack the top three.
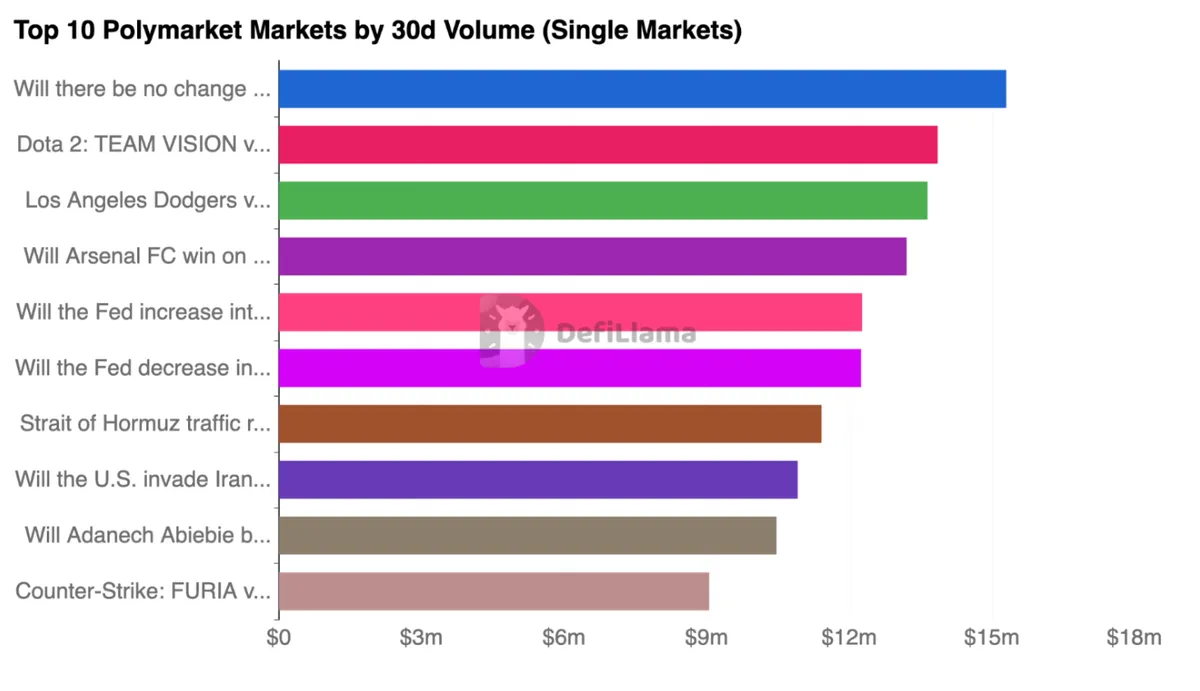
On Polymarket, since they do individual markets, the single biggest individual market anywhere isn't sports or crypto at all — it's a Fed no-change-in-rates contract, at $15.3M on one contract, more than 7x bigger than the biggest single Bitcoin 15-minute contract ($2.1M). The next four spots are also: a Dota 2 playoff series ($13.9M), a Dodgers-Braves game ($13.6M), an Arsenal FC match ($13.2M), and a Fed +25bps contract ($12.3M).
Bet Size Across Kalshi And Polymarket
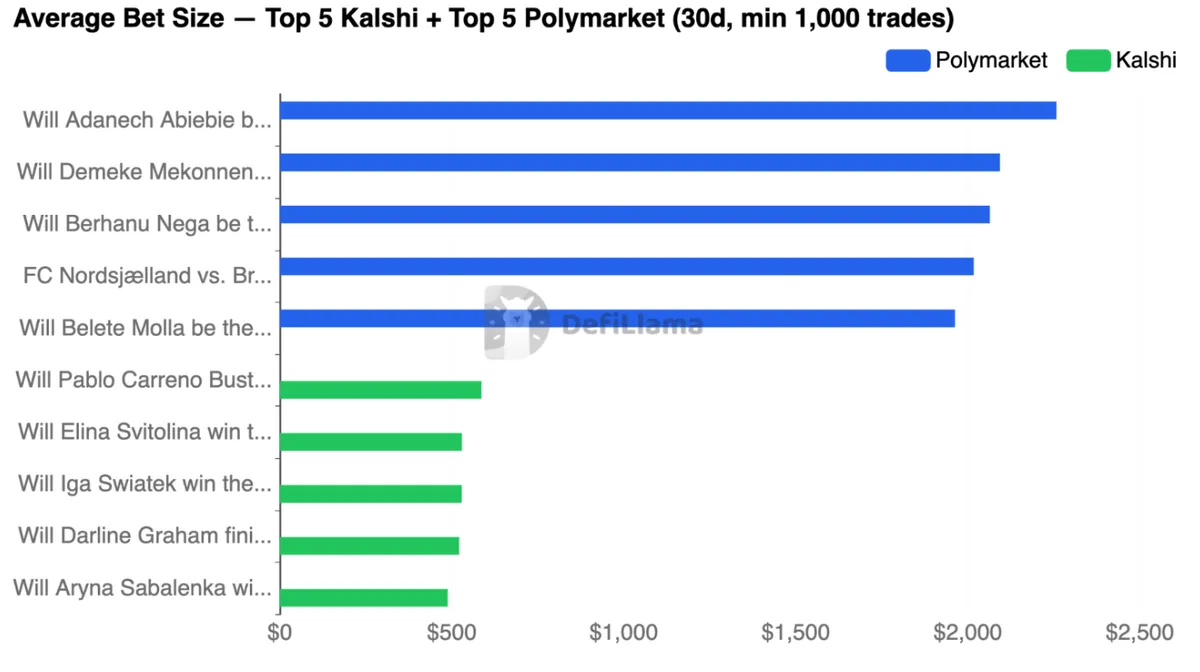
The chart itself shows the Top 5 average bet size on each venue, ranked by notional volume ÷ trade count, restricted to markets with at least 1,000 trades. Polymarket's five (all political/sports) sit well above Kalshi's five (tennis, tennis, tennis, primary, tennis) — the highest average bet on Polymarket is roughly 3.9x the highest average bet on Kalshi.
Average bet size skews heavily toward Polymarket's political and macro markets: the two Ethiopian election contracts average $2,257.60 and $2,093.60 per trade, and a third Ethiopian contract, a Danish football O/U market, and a fourth Ethiopian contract all clear $1,900+ per trade.
Kalshi's own ceiling is much lower — its highest average bet size is an ATP tennis match (Carreno Busta) at $586.06 per trade, followed by a WTA match ($529.35), another WTA match ($528.82), a South Carolina primary contract ($521.38), and a third WTA match ($488.25).
Even Kalshi's highest average bet size doesn't crack Polymarket's top five, reinforcing the earlier point: Polymarket's niche political and geopolitical markets draw fewer but far larger, higher-conviction positions than anything Kalshi's contract structure produces.
Trade Count Across Kalshi And Polymarket
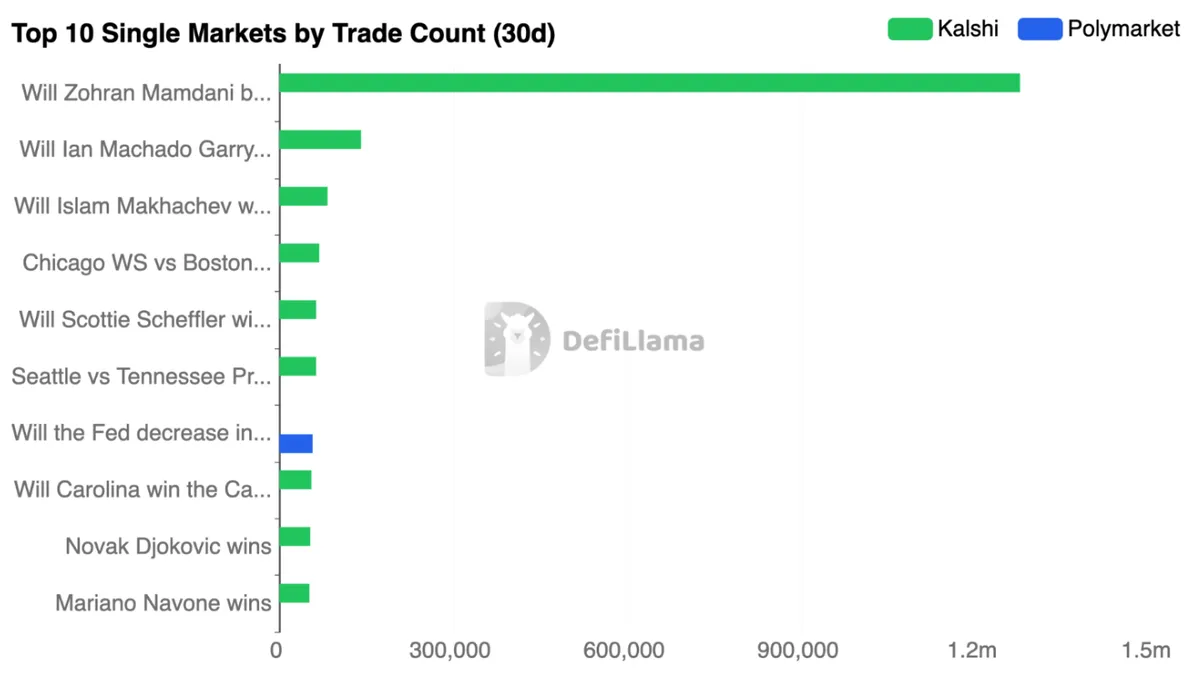
Ranking every individual market by raw trade count — not just the biggest-dollar ones — turns up a different leaderboard than volume does . Kalshi's 2028 Democratic primary market ("Will Zohran Mamdani be the Democratic Presidential nominee in 2028?") leads by a wide margin at 1.28 million trades over 30 days, followed by Kalshi's UFC fight market (Islam Makhachev vs. Ian Machado Garry) at 140,885 trades. Below that, Kalshi single-game markets (MMA, MLB, PGA Tour, NFL, tennis) cluster in the 51K–107K trade range, with one Polymarket market (a Fed rate-decrease contract) cracking the top 10 at 57,483 trades.
Two markets that would otherwise rank highly by trade count — a Shakhtar Donetsk market (4.52 million trades) and an LPL esports market (Ultra Prime win LPL 2026, 59,986 trades) — are excluded here: both average under $0.02 per trade, the same automated-activity signature flagged in the bet-size section, so they're left out of this "real activity" ranking.
External Prediction Markets
As we mentioned above, the data set we’re working with only covers Polymarket and Kalshi. TradFi venues do exist and are catching up, but due to obscure data, it’s difficult to figure out what they’re doing. Also, they’re not all standalone prediction markets.
Robinhood
For one - Robinhood doesn't run its own prediction market — it's a storefront on top of others' exchanges. When a Robinhood user trades an "event contract" in the app, that trade is actually executed on one of three separately-regulated exchanges behind the scenes: KalshiEX (Kalshi's own exchange), ForecastEx (owned by Interactive Brokers), or Rothera Exchange and Clearing.
Based on the SEC filings, it seems to be doing well - it is breaking out event-contract revenue: $104M in Q1 2026 (up from $3M in Q1 2025) and $156M in Q2 2026 (up from $10M in Q2 2025), for $260M in H1 2026 versus $13M in H1 2025 — a 1,900% year-over-year jump in the first half. Quarter-over-quarter, Robinhood's event-contract revenue grew 50% from Q1 to Q2.
However, they are trying to stop being a distributor. It co-owns Rothera, registered with the CFTC as a designated contract market — a CFTC-licensed exchange and clearinghouse that Robinhood and Susquehanna acquired and rebranded. When the World Cup opened on June 11, Robinhood routed the core markets — match outcomes, tournament winner, spreads, totals — through its own exchange, while player props and parlay-style combinations continued to route to Kalshi.
The migration is partial. Since June 15, roughly 40% of Robinhood's prediction-market volume has gone to Rothera, with the other 60% — more than $150 million per day — still directed to Kalshi.
This is the single biggest medium-term risk to the Kalshi line in the charts above, and it has nothing to do with Polymarket. If Robinhood completes the migration, Kalshi loses volume that was never really its own demand.
CME Group
CME Group is the biggest of the traditional exchanges to move into this space — its event contracts hit 100 million contracts traded within eight weeks of a December launch . But CME's own strategy is distribution-first: it doesn't sell directly to retail, it partners with consumer apps. FanDuel Predicts, launched via a CME partnership, routes CME-listed contracts (sports, S&P 500, oil, GDP, CPI) to FanDuel's existing sports-betting user base.
DraftKings runs a similar arrangement — its own Predictions product currently lists contracts from CME Group and Crypto.com, though DraftKings has separately been self-certifying contracts on its own newly-branded exchange, DKeX (operated through its acquired Railbird Exchange), suggesting it eventually wants to stop routing through CME and run its own book.
So CME functions less like "one more venue" and more like backend infrastructure other consumer brands plug into — the same routing pattern as Robinhood-into-Kalshi, just with a different exchange underneath.
Interactive Brokers
Interactive Brokers' ForecastEx sits at a different end of the market entirely — institutional and hedging-oriented rather than retail-attention-driven. Its most-traded contracts are temperature/weather contracts, not sports or politics, and its own leadership frames the product as risk-transfer infrastructure for hedging climate and economic exposure, not a betting app.
Volume there has scaled quickly on a relative basis — 286 million contract pairs in one recent quarter, up from 15 million the quarter before, with over 10,000 listed instruments — though IBKR doesn't break out revenue or dollar volume for the segment the way Robinhood does, so this is a contract-count data point only, not something comparable to the revenue figures already shown.
Interactive Brokers has also since launched "IBKR Prediction Markets," a smart-order-router that aggregates contracts listed on ForecastEx, CME, and Kalshi into one interface, picking whichever venue offers the best price — meaning IBKR customers may already be trading directly against Kalshi's own liquidity too, the same cross-venue overlap flagged with Robinhood.
We can see the same pattern repeating here - most of these aren’t separate liquidity pools competing head-to-head with Kalshi and Polymarket — they're mostly front-ends and routing layers sitting on top of a small number of underlying regulated exchanges (Kalshi's own exchange, ForecastEx, CME, and now DraftKings' DKeX). Except for Robinhood who are trying to genuinely compete, this is where the external prediction markets segment sits right now.
Concluding Thoughts
And so — are prediction markets still hot? The answer is pretty much yes, although Google Trends would have you believe otherwise.
Search interest fell from 86 in July to 36 in August. If that were all you looked at, you'd conclude the category had rolled over. It hasn't. Over fourteen months, monthly volume went from $954.7M to a $19.06B peak, an increase of over 1,896.8%, with six consecutive months of acceleration (July 2025 through January 2026) . The category is still doing $3.72B a week.
It is true that the last eight weeks have been a drawdown. Weekly volume is down 25.8% from the June 29 peak, fees are down 23.2% month-on-month, and August is tracking below July's daily pace on both . But the World Cup ended on July 19, and the decline starts almost exactly there. A category that gets 52.3% of its volume from sports is going to fall when the biggest sporting event in the world finishes. Nothing in the data yet says this is structural rather than seasonal.
What's happened is that attention fell faster than activity. Search interest more than halved while volume fell about a quarter. Prediction markets don't show up on any current list of hot crypto narratives, and a multi-billion-dollar weekly business keeps running underneath anyway. That's probably a healthier place for the category to be, since what's left is far less narrative-driven than the volume that showed up during the election and World Cup cycles.
There's also a more interesting story inside the pullback. Kalshi is down 13.2% from its weekly peak. Polymarket (International + US combined) is down 49.0% . One platform is losing and the other is holding, and Polymarket's problems are largely self-inflicted: a first-ever fee change in March, a delayed infrastructure fix, a disruptive settlement-token migration and a CFTC investigation.
The category is also not what its reputation suggests. Sports and short-dated crypto price contracts make up 76.9% of everything traded. Politics, geopolitics, macro, science and entertainment, which generate almost all of the media coverage and all of the "prediction markets as truth machines" discourse, come to just 5.5% of volume combined.
Lastly, competition is coming, though not at the layer you'd expect. Robinhood, CME, DraftKings, FanDuel and Interactive Brokers are mostly front-ends and routing layers sitting on top of a handful of regulated exchanges. None of them are trying to out-build Kalshi's order book. They're trying to own the customer in front of it. Which means Kalshi's volume lead is partly a fact about Kalshi and partly a fact about who routes order flow to it, with Robinhood still sending more than $150M a day while it migrates the rest to Rothera. The next twelve months look like a distribution fight rather than a liquidity one, and the venues that own the customer can move volume between exchanges overnight without a single user noticing.
The three things that are left to watch are:
The NFL season, to test if August is seasonal or structural.
Robinhood's Rothera migration, the largest medium-term risk to Kalshi's reported volume, and one that has nothing to do with Polymarket.
Whether Polymarket stabilises. Two straight quarters of operational failure is a pattern rather than an accident, and if it doesn't recover share by year-end, they might continue losing out.